Performance is the first thing that people think of when they are concerned about their APIs. By scheduling accuracy tests to run automatically, the data from those executions can then be used for proper insight into how the API is performing globally.
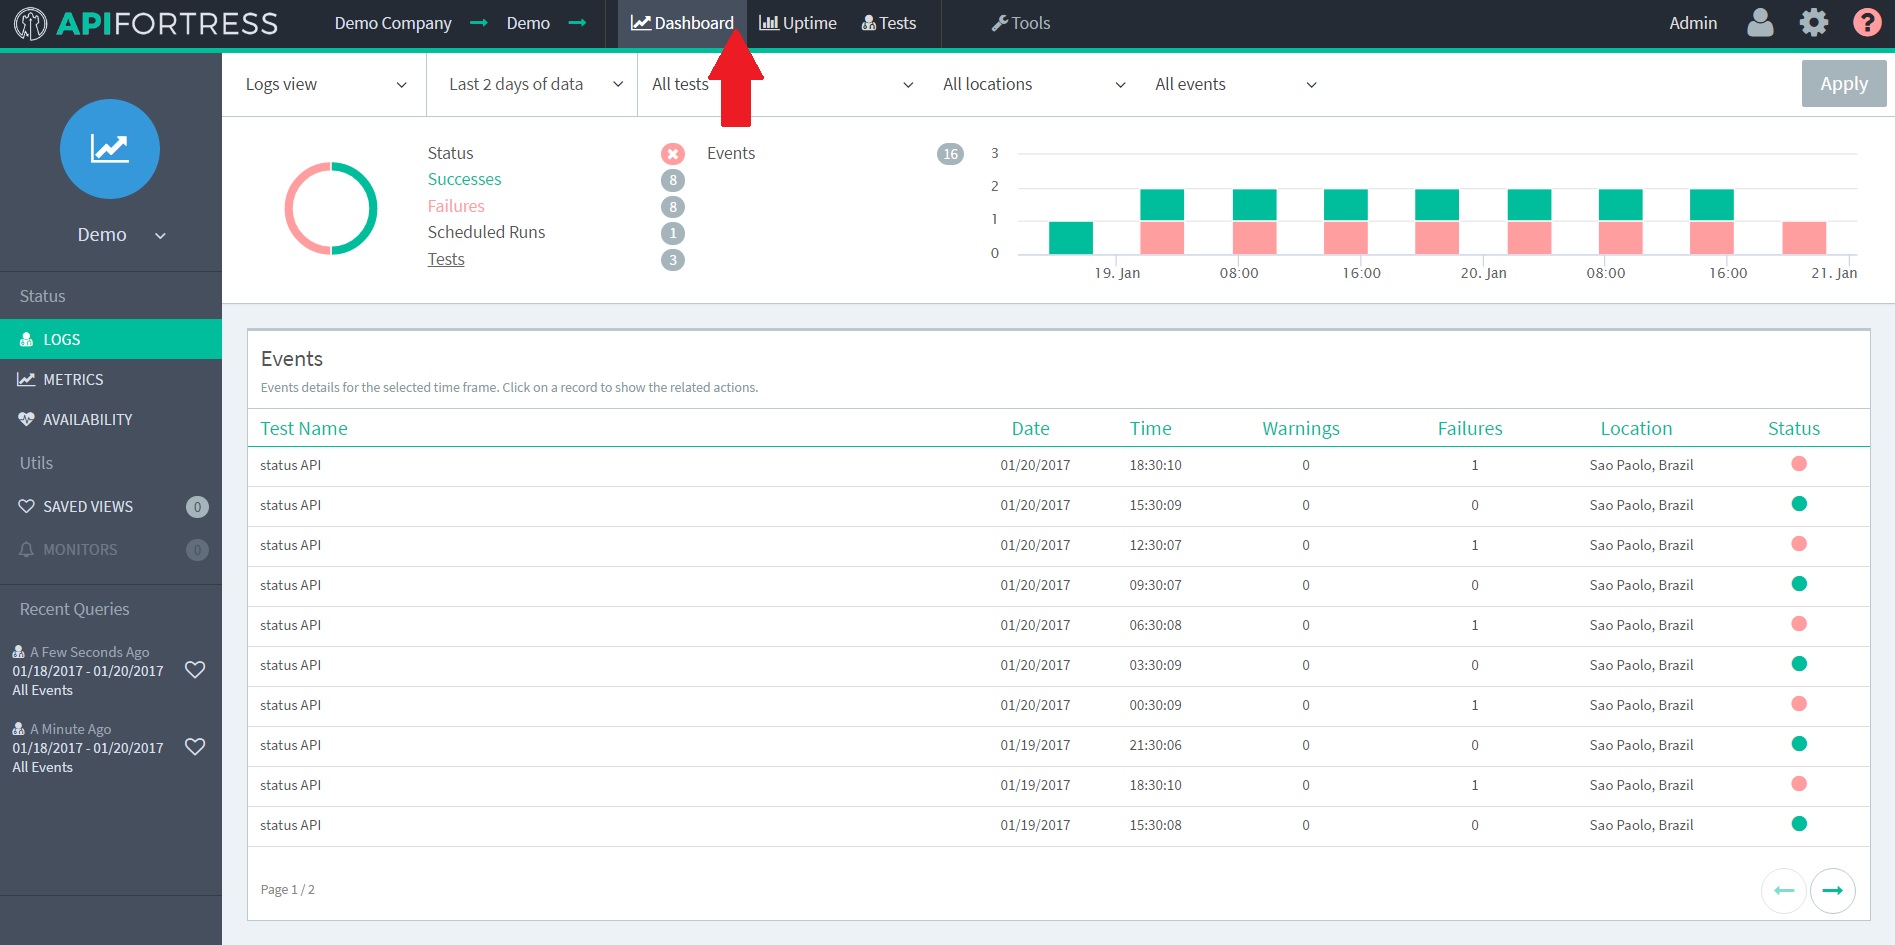
Step 1. Go to the Dashboard
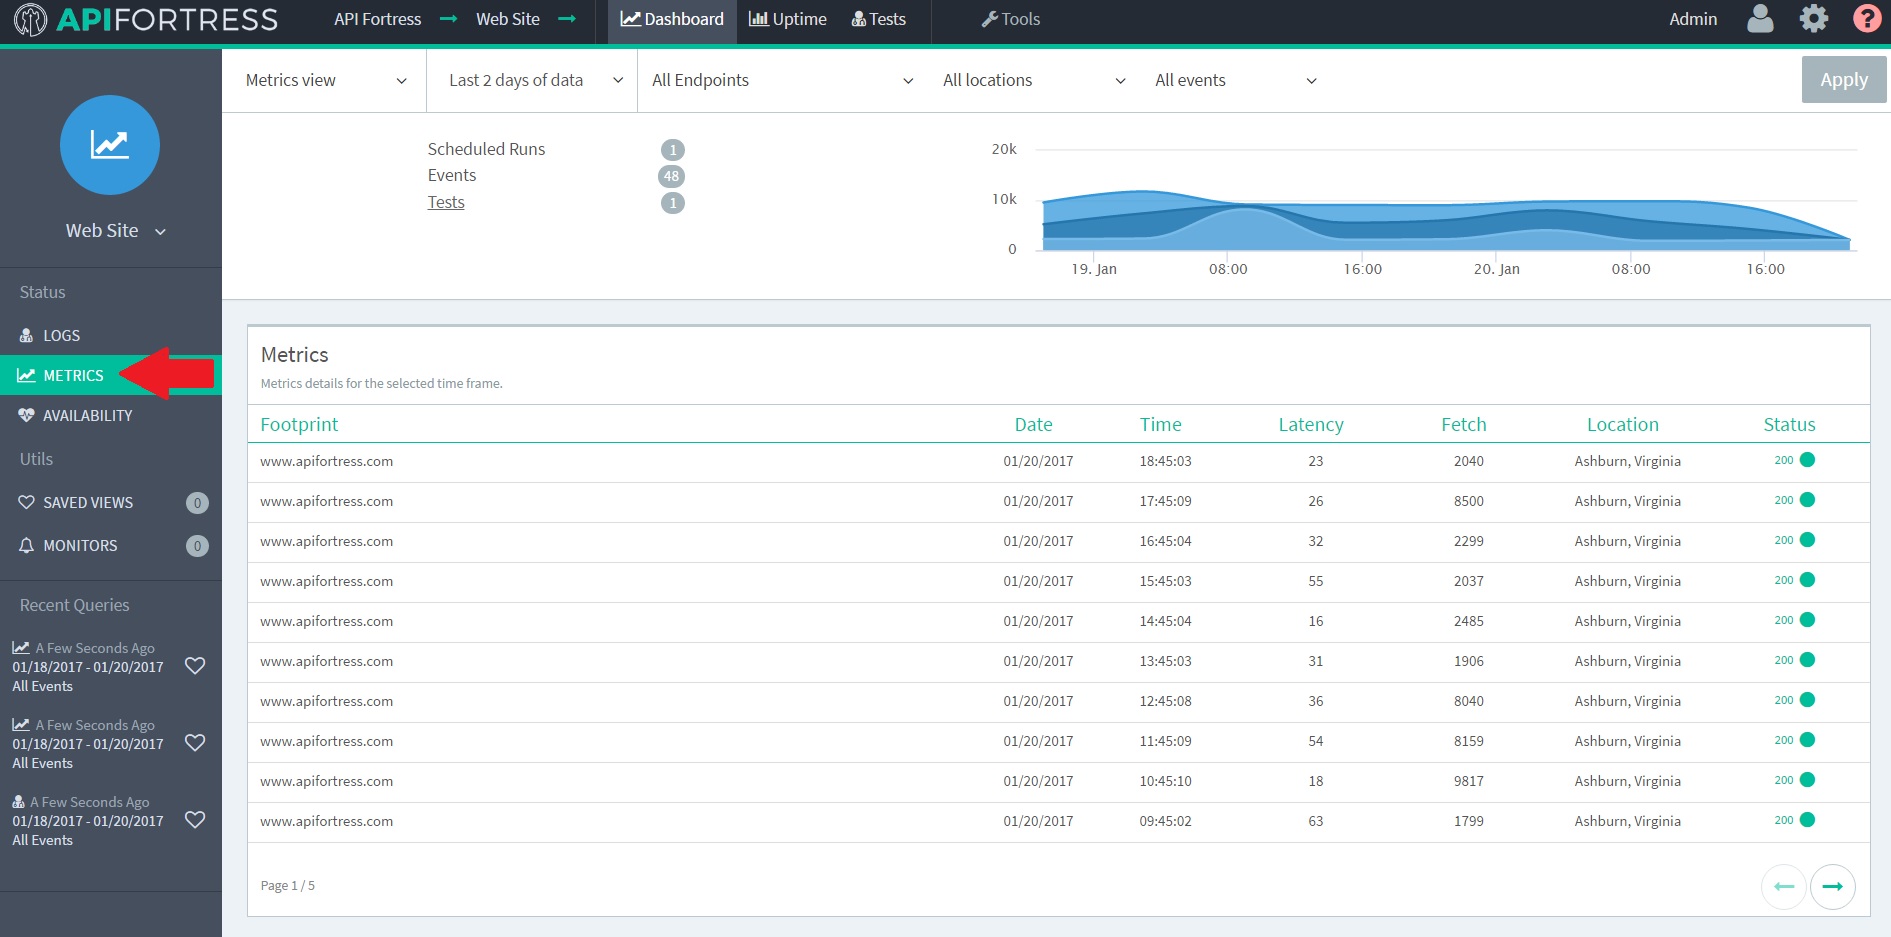
Step 2. Click on Metrics
Step 3. Click on a Footprint
Step 4. Click on the Bell to Add a Monitor
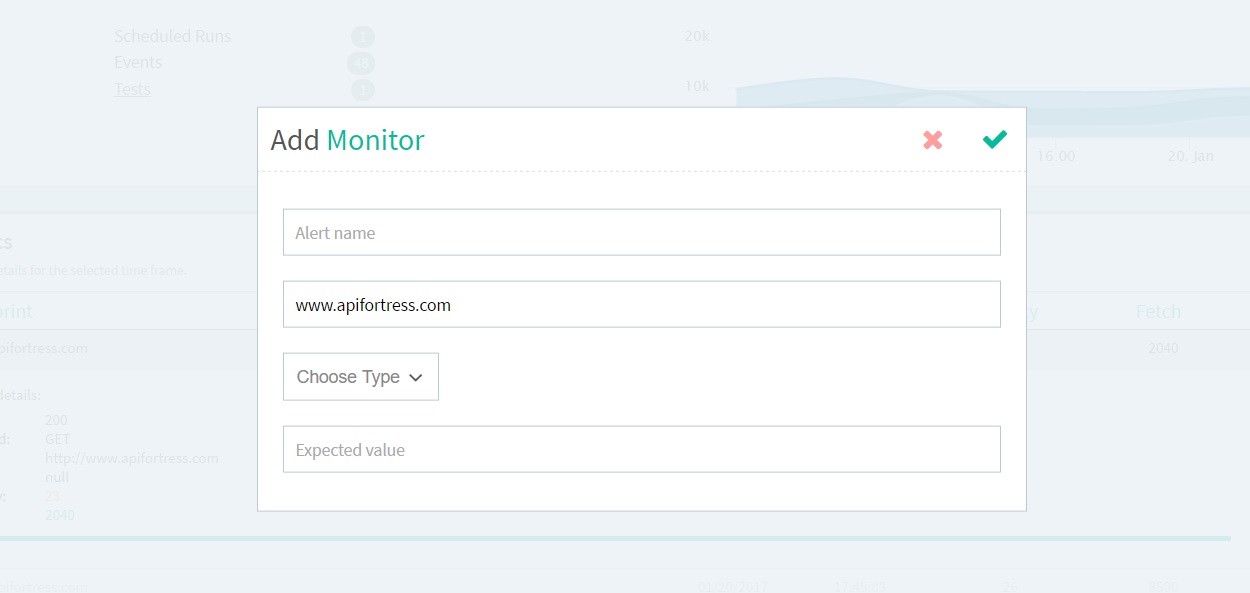
Step 5. Fill in the Information
Enter the name of the alert, select the type of monitor (latency or fetch), and the max value for the trigger. Latency is the time it takes to ping the endpoint and receive a response. Fetch is the time it takes to download the response itself. Large responses will lead to large fetch times, so be aware of this when setting a number. Values are in milliseconds.
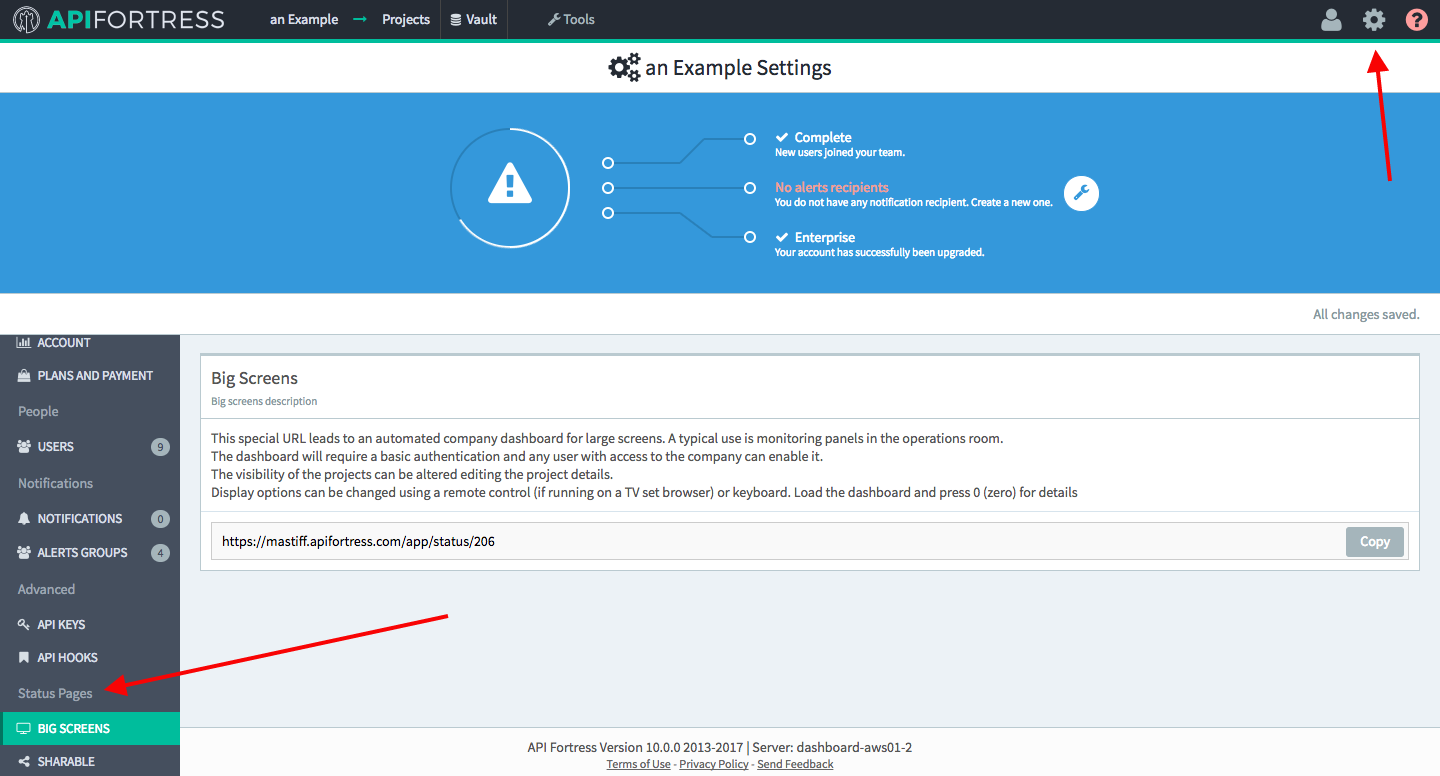
This may be the easiest doc of them all. Generating a status page is as simple as clicking the Gear icon in the top right corner of the page, and going to the Status Pages section.
There are two options here. Big Screens automatically refreshes itself, so it works really well for TVs or monitors in a DevOps office, for example. This view is only viewable by users registered to your company. Shareable generates a link that gives a snapshot of the API’s health at the moment the page is loaded. It can be shared publicly without needing an account with API Fortress.
Arrows to the Gear icon and Status Pages section of the Settings page.


 Enter the name of the alert, select the type of monitor (latency or fetch), and the max value for the trigger. Latency is the time it takes to ping the endpoint and receive a response. Fetch is the time it takes to download the response itself. Large responses will lead to large fetch times, so be aware of this when setting a number. Values are in milliseconds.