Using the Elastic connector you can send failure information to Elasticsearch then use that data to create visualizations in Kibana.
Below is a quick guide to setting up and using the Elastic connector.
Note: this connector does not come pre-loaded out of the box, and will need to be loaded separately. To learn how to load the connector into your API Fortress instance click here.Configure the Connector
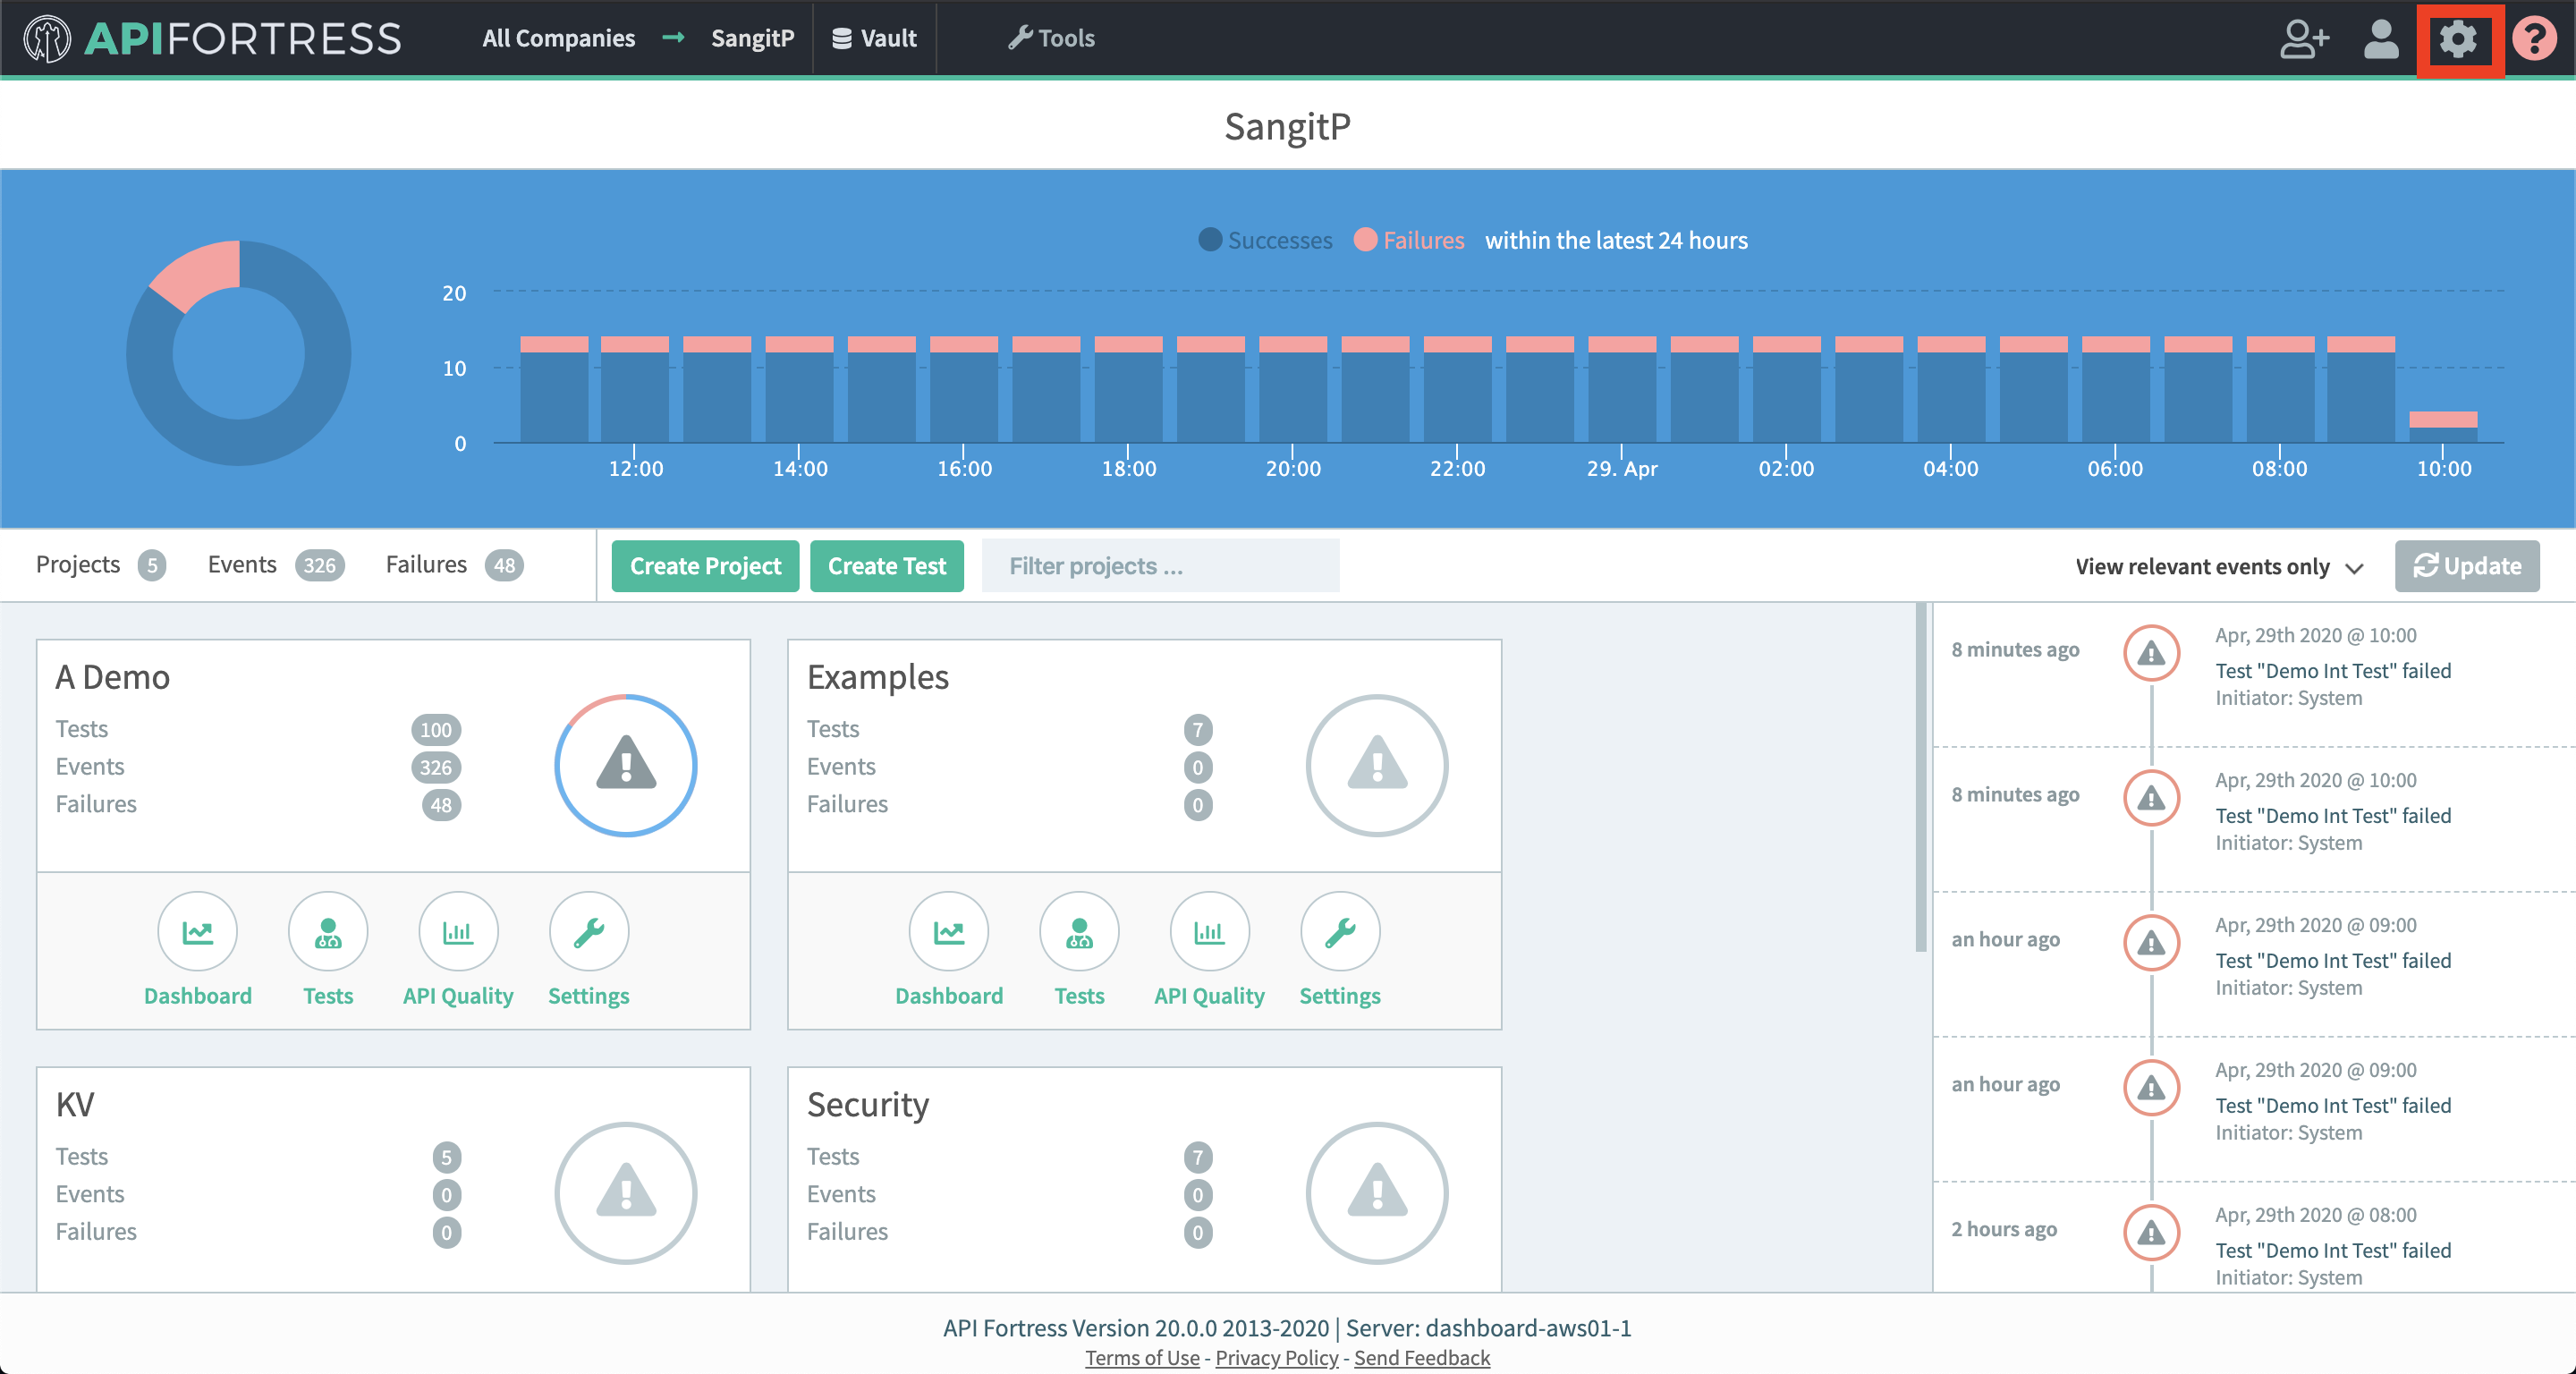
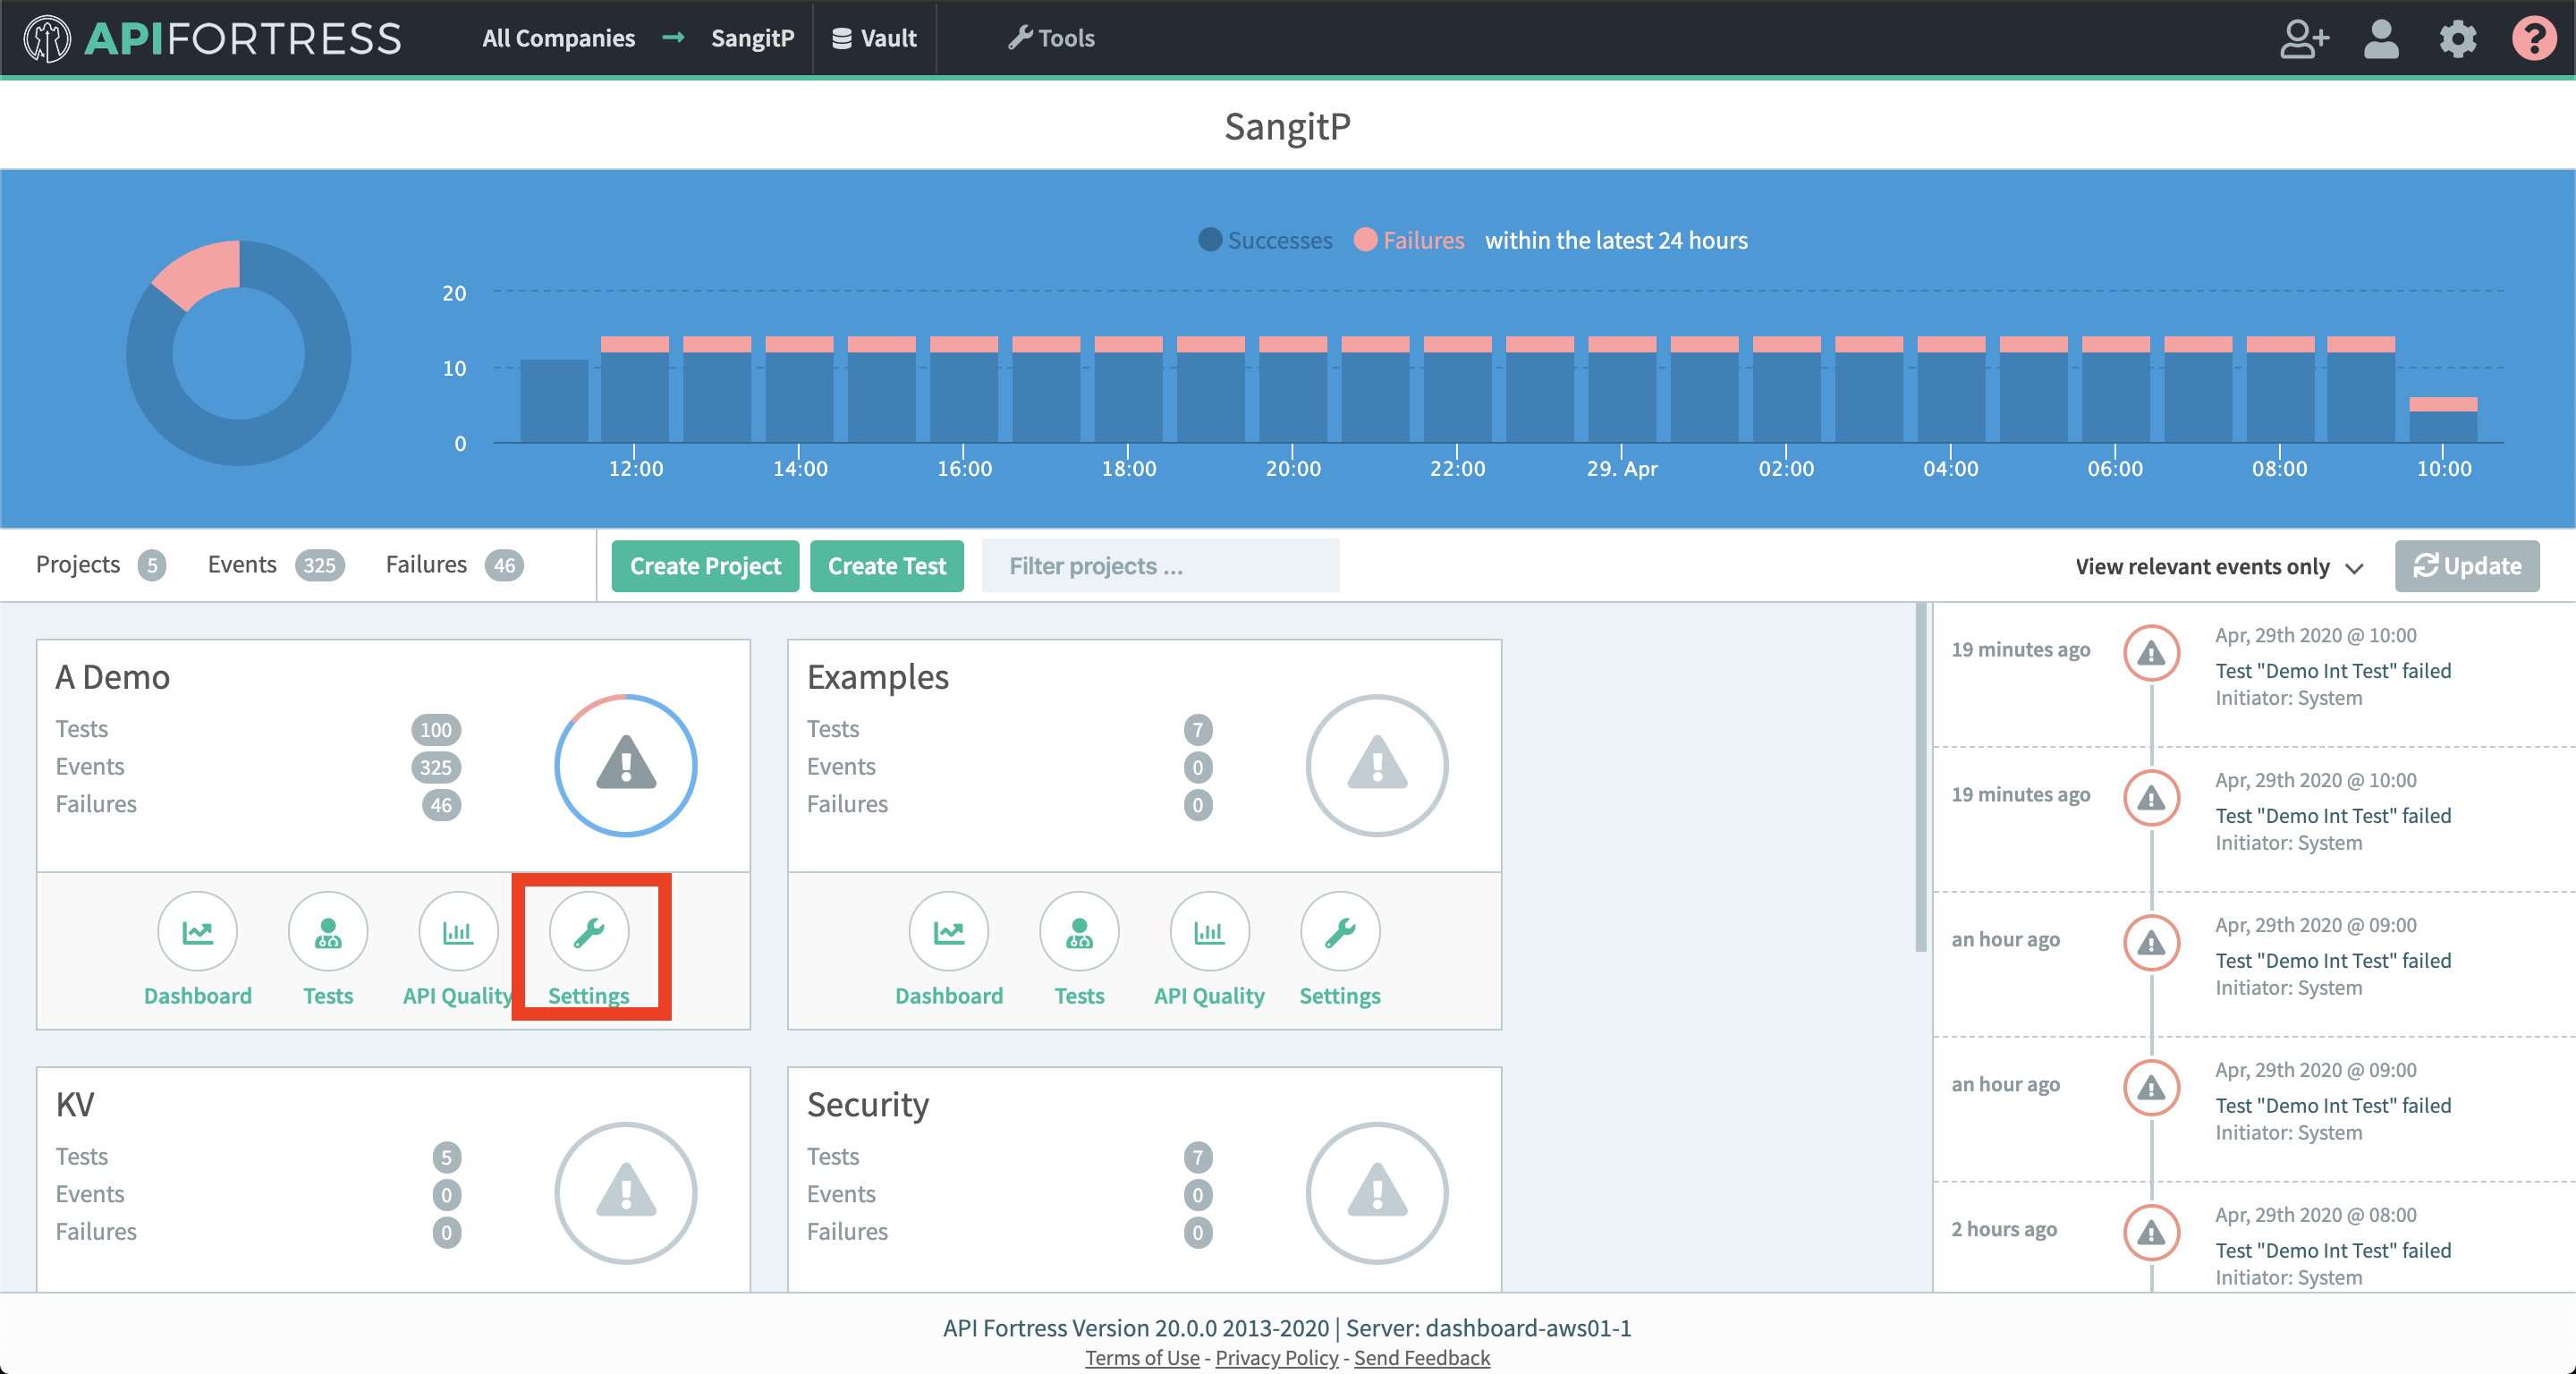
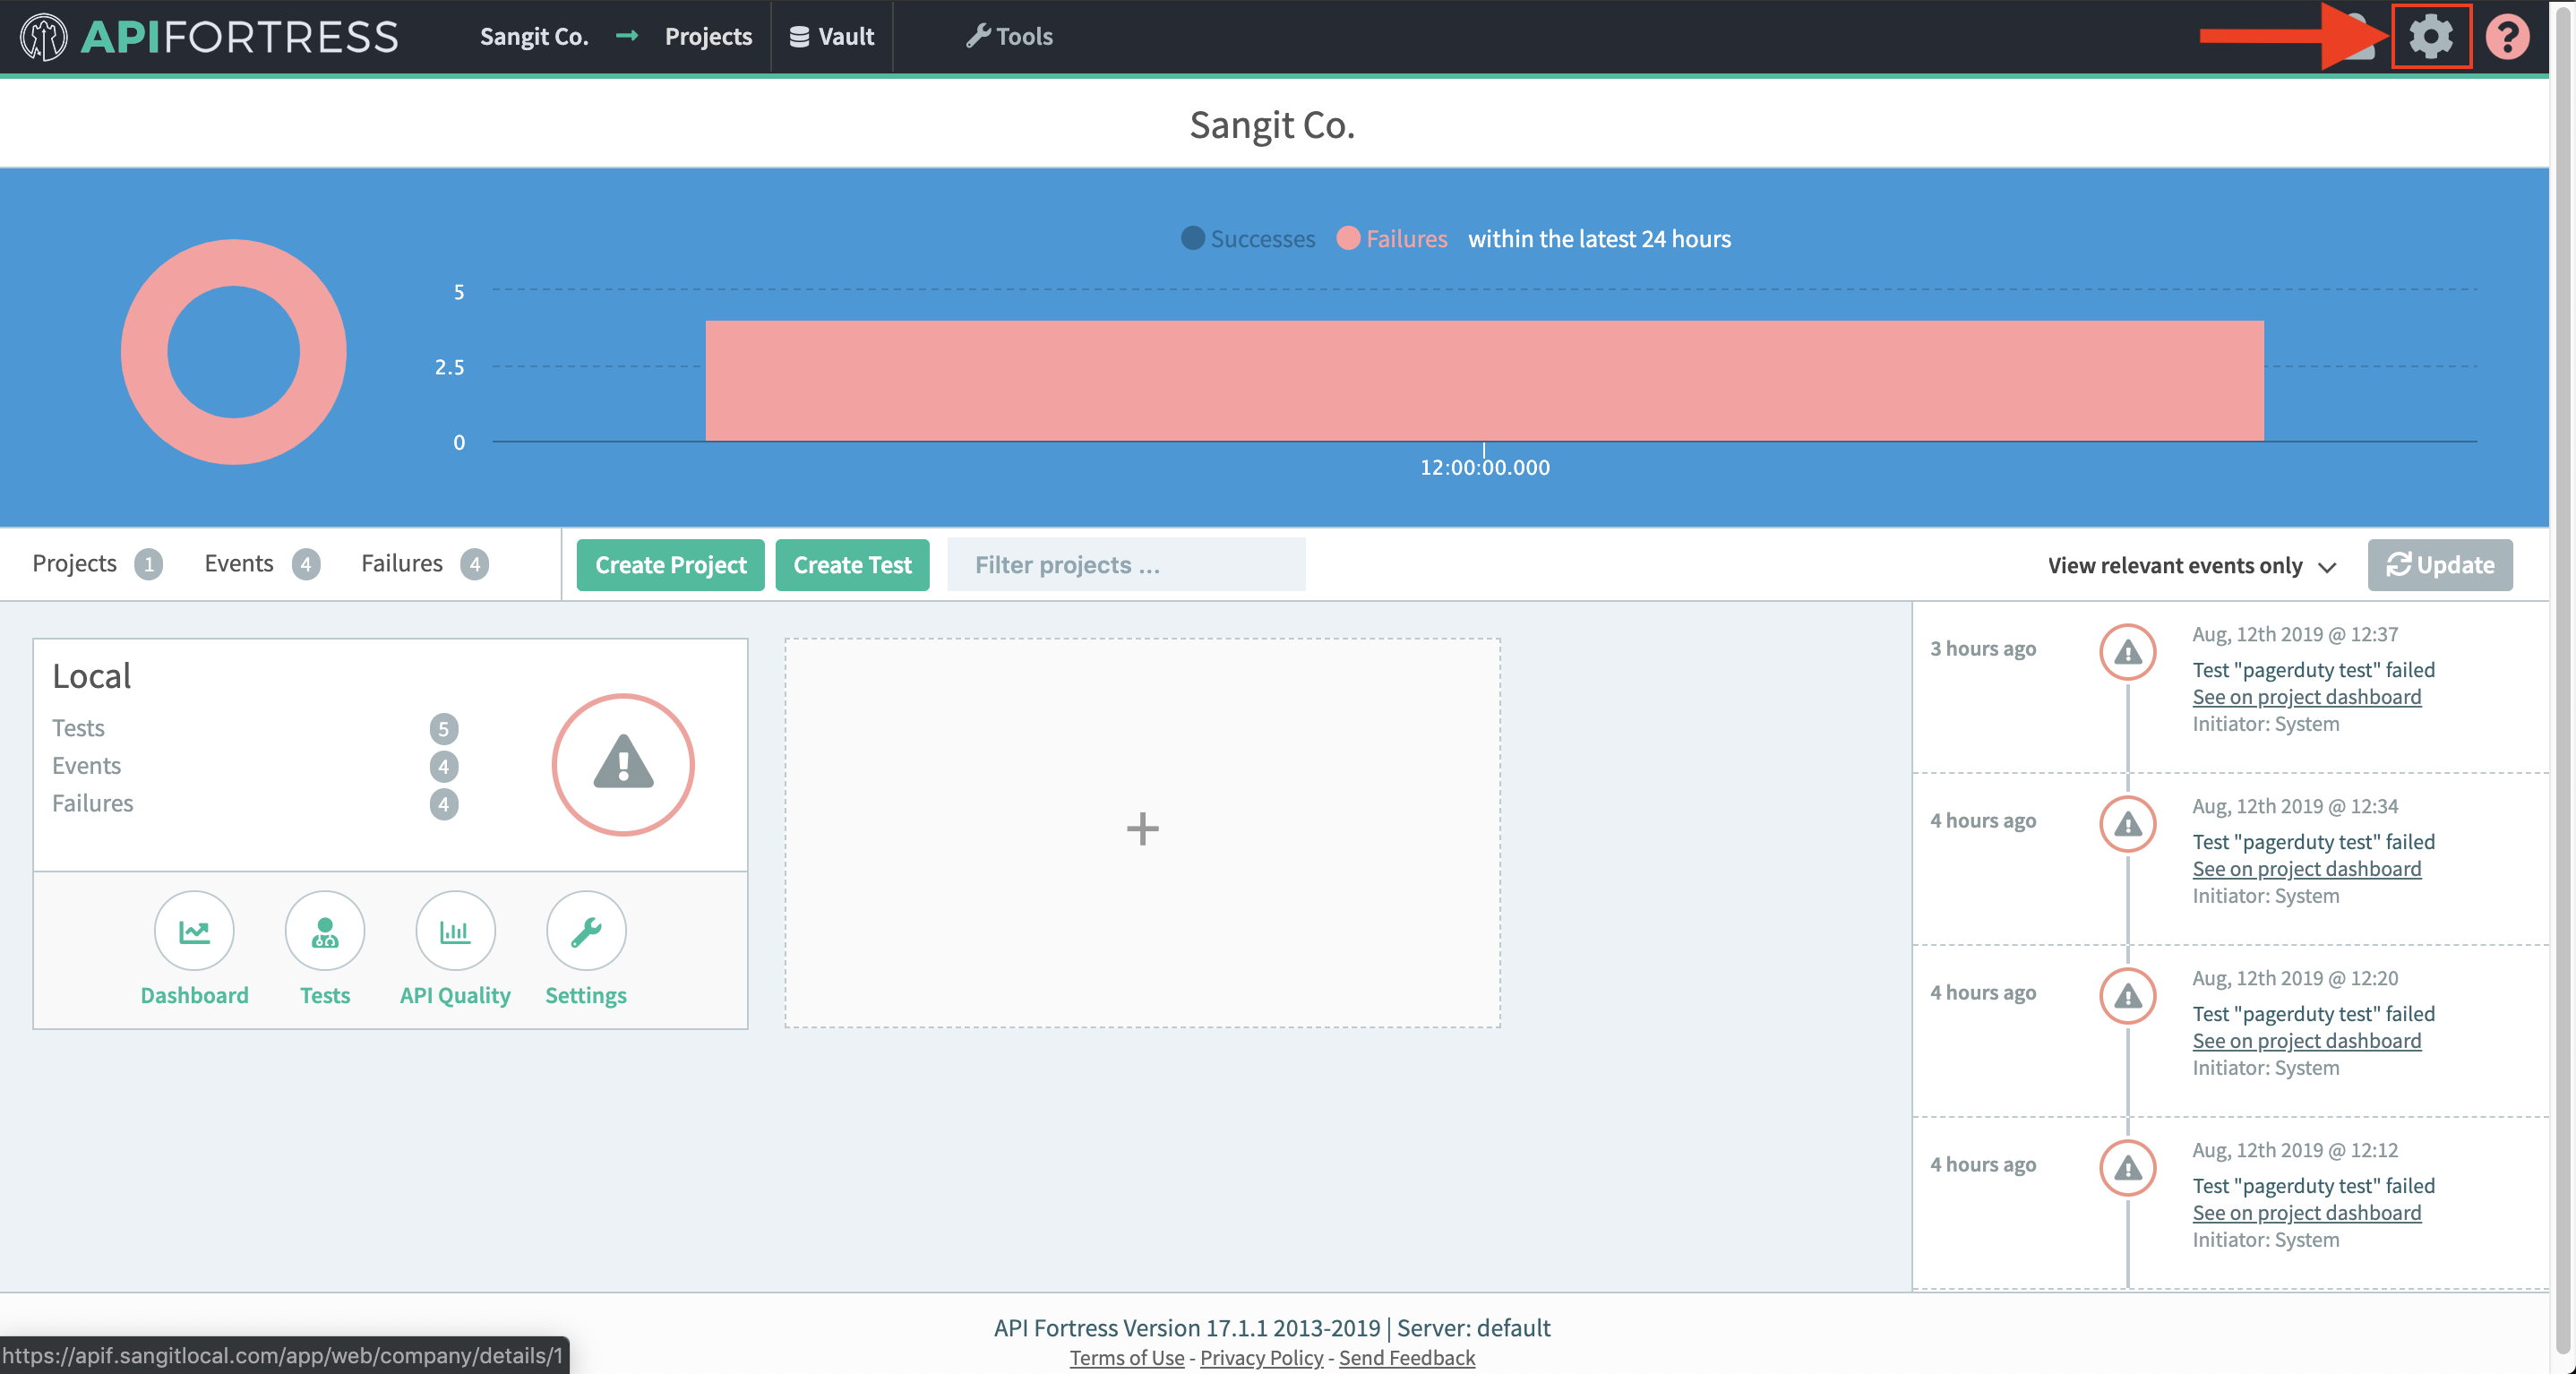
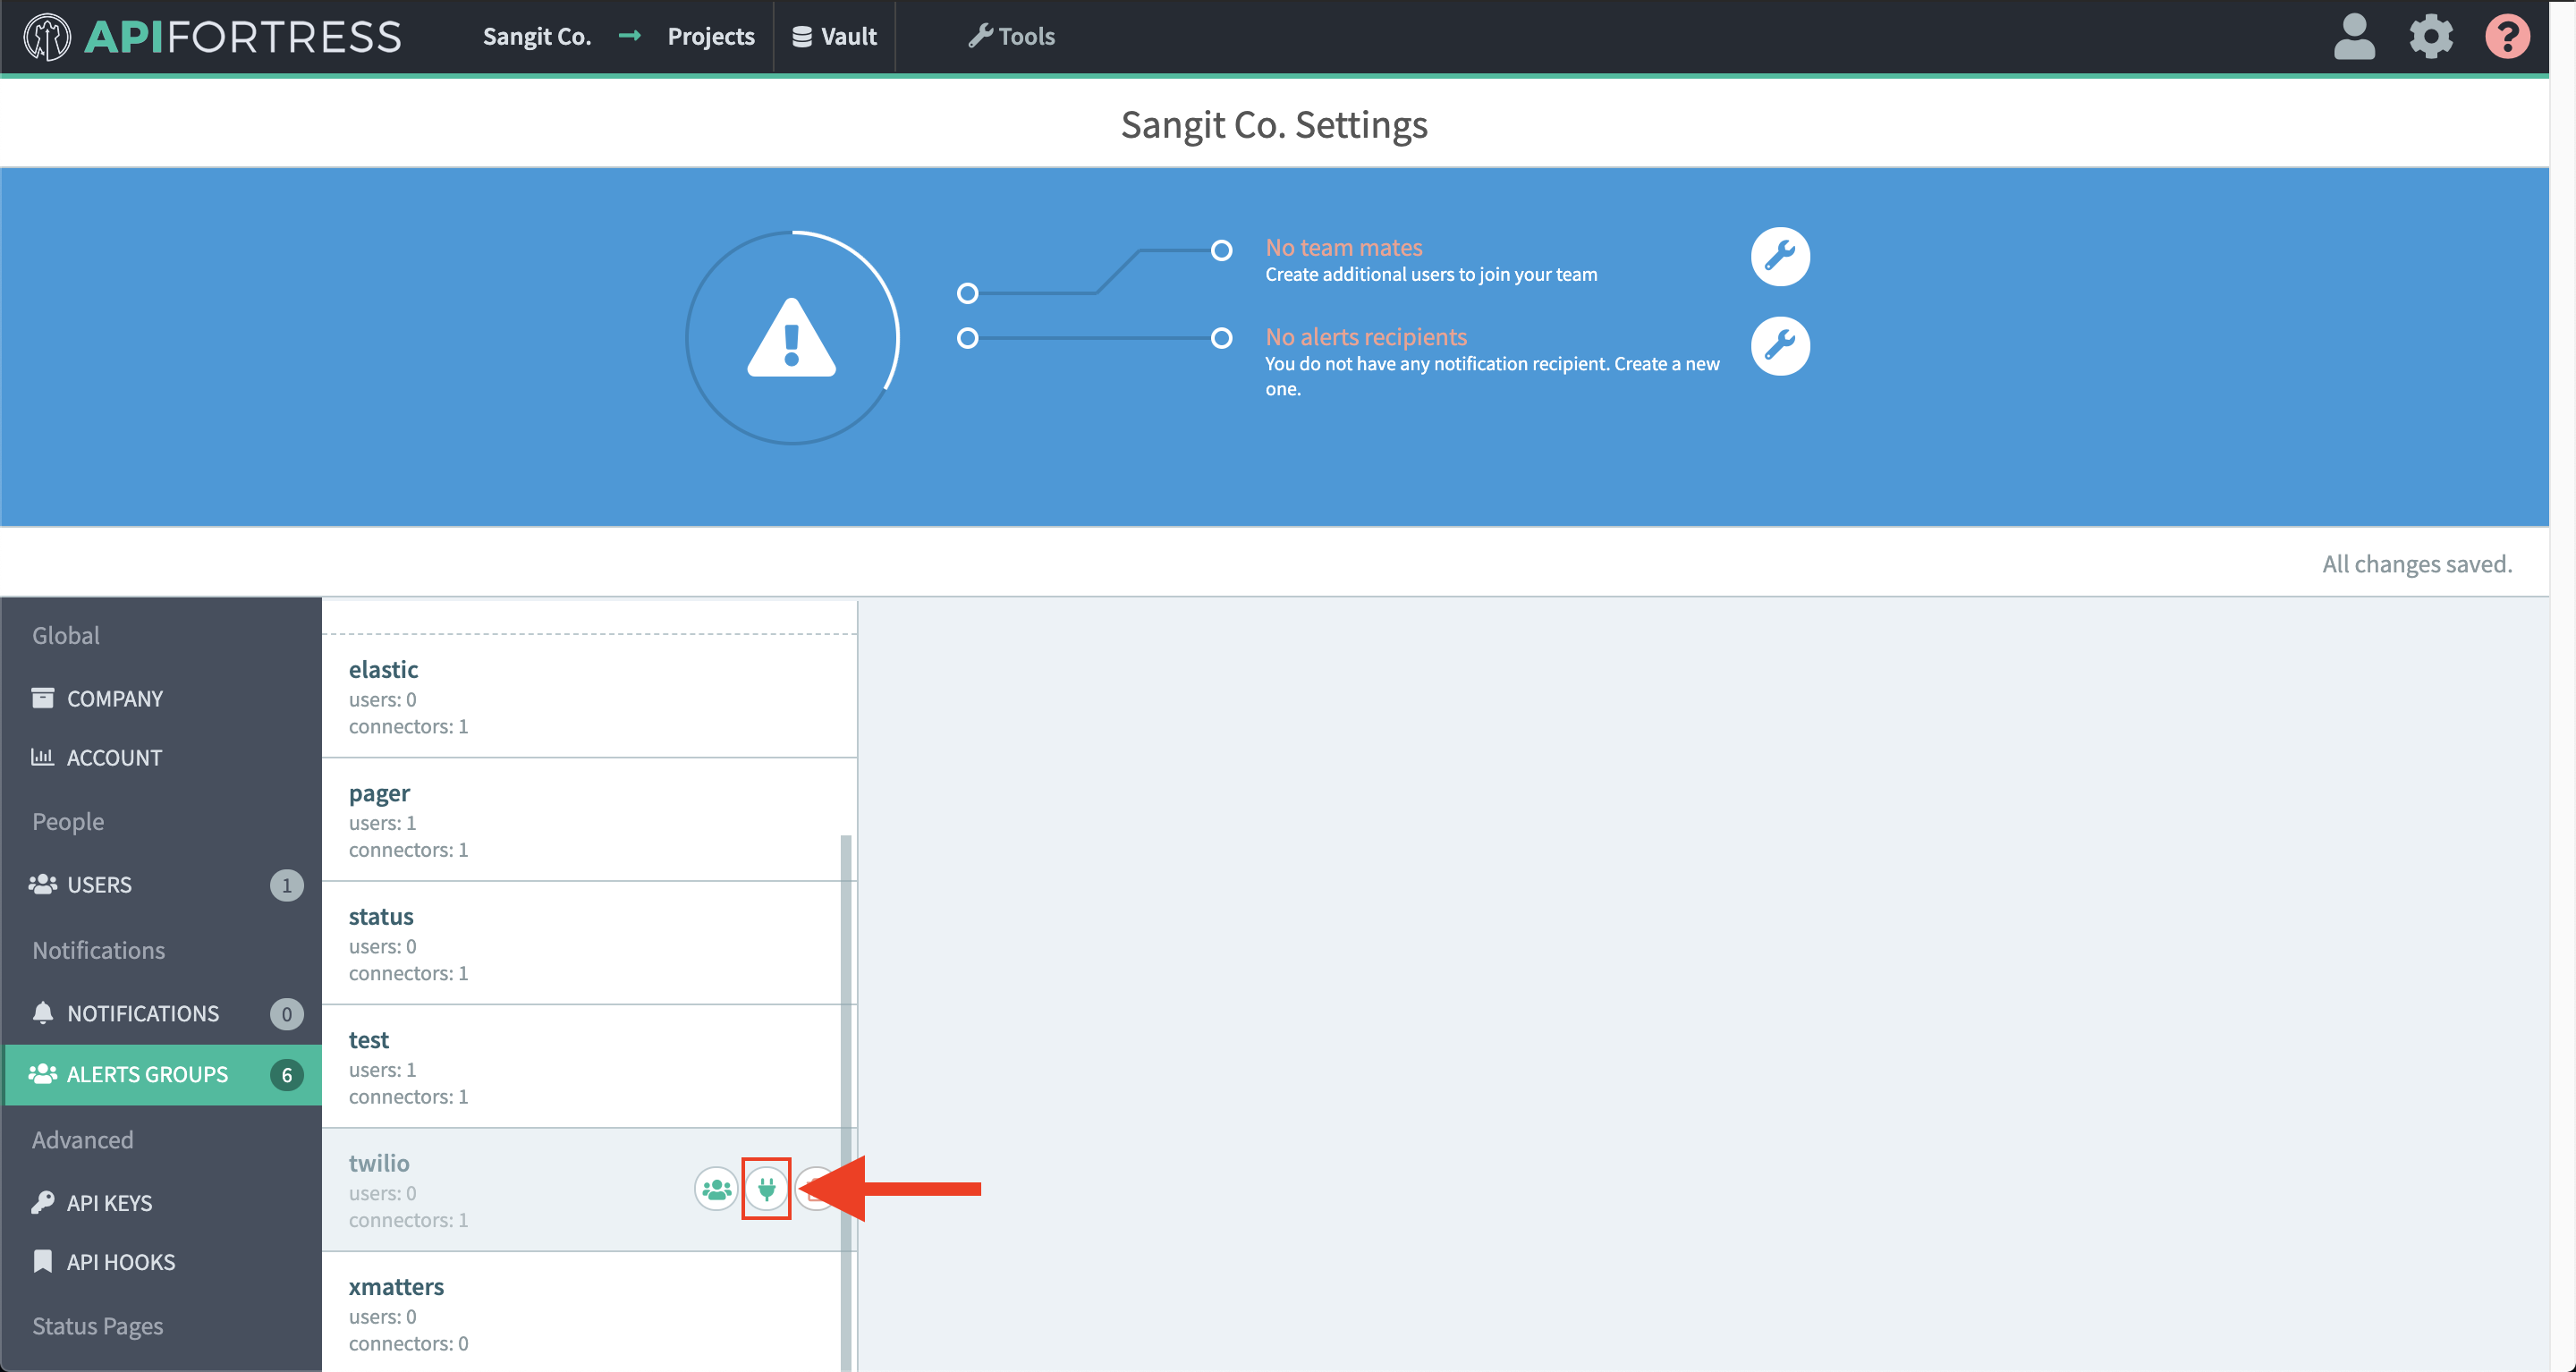
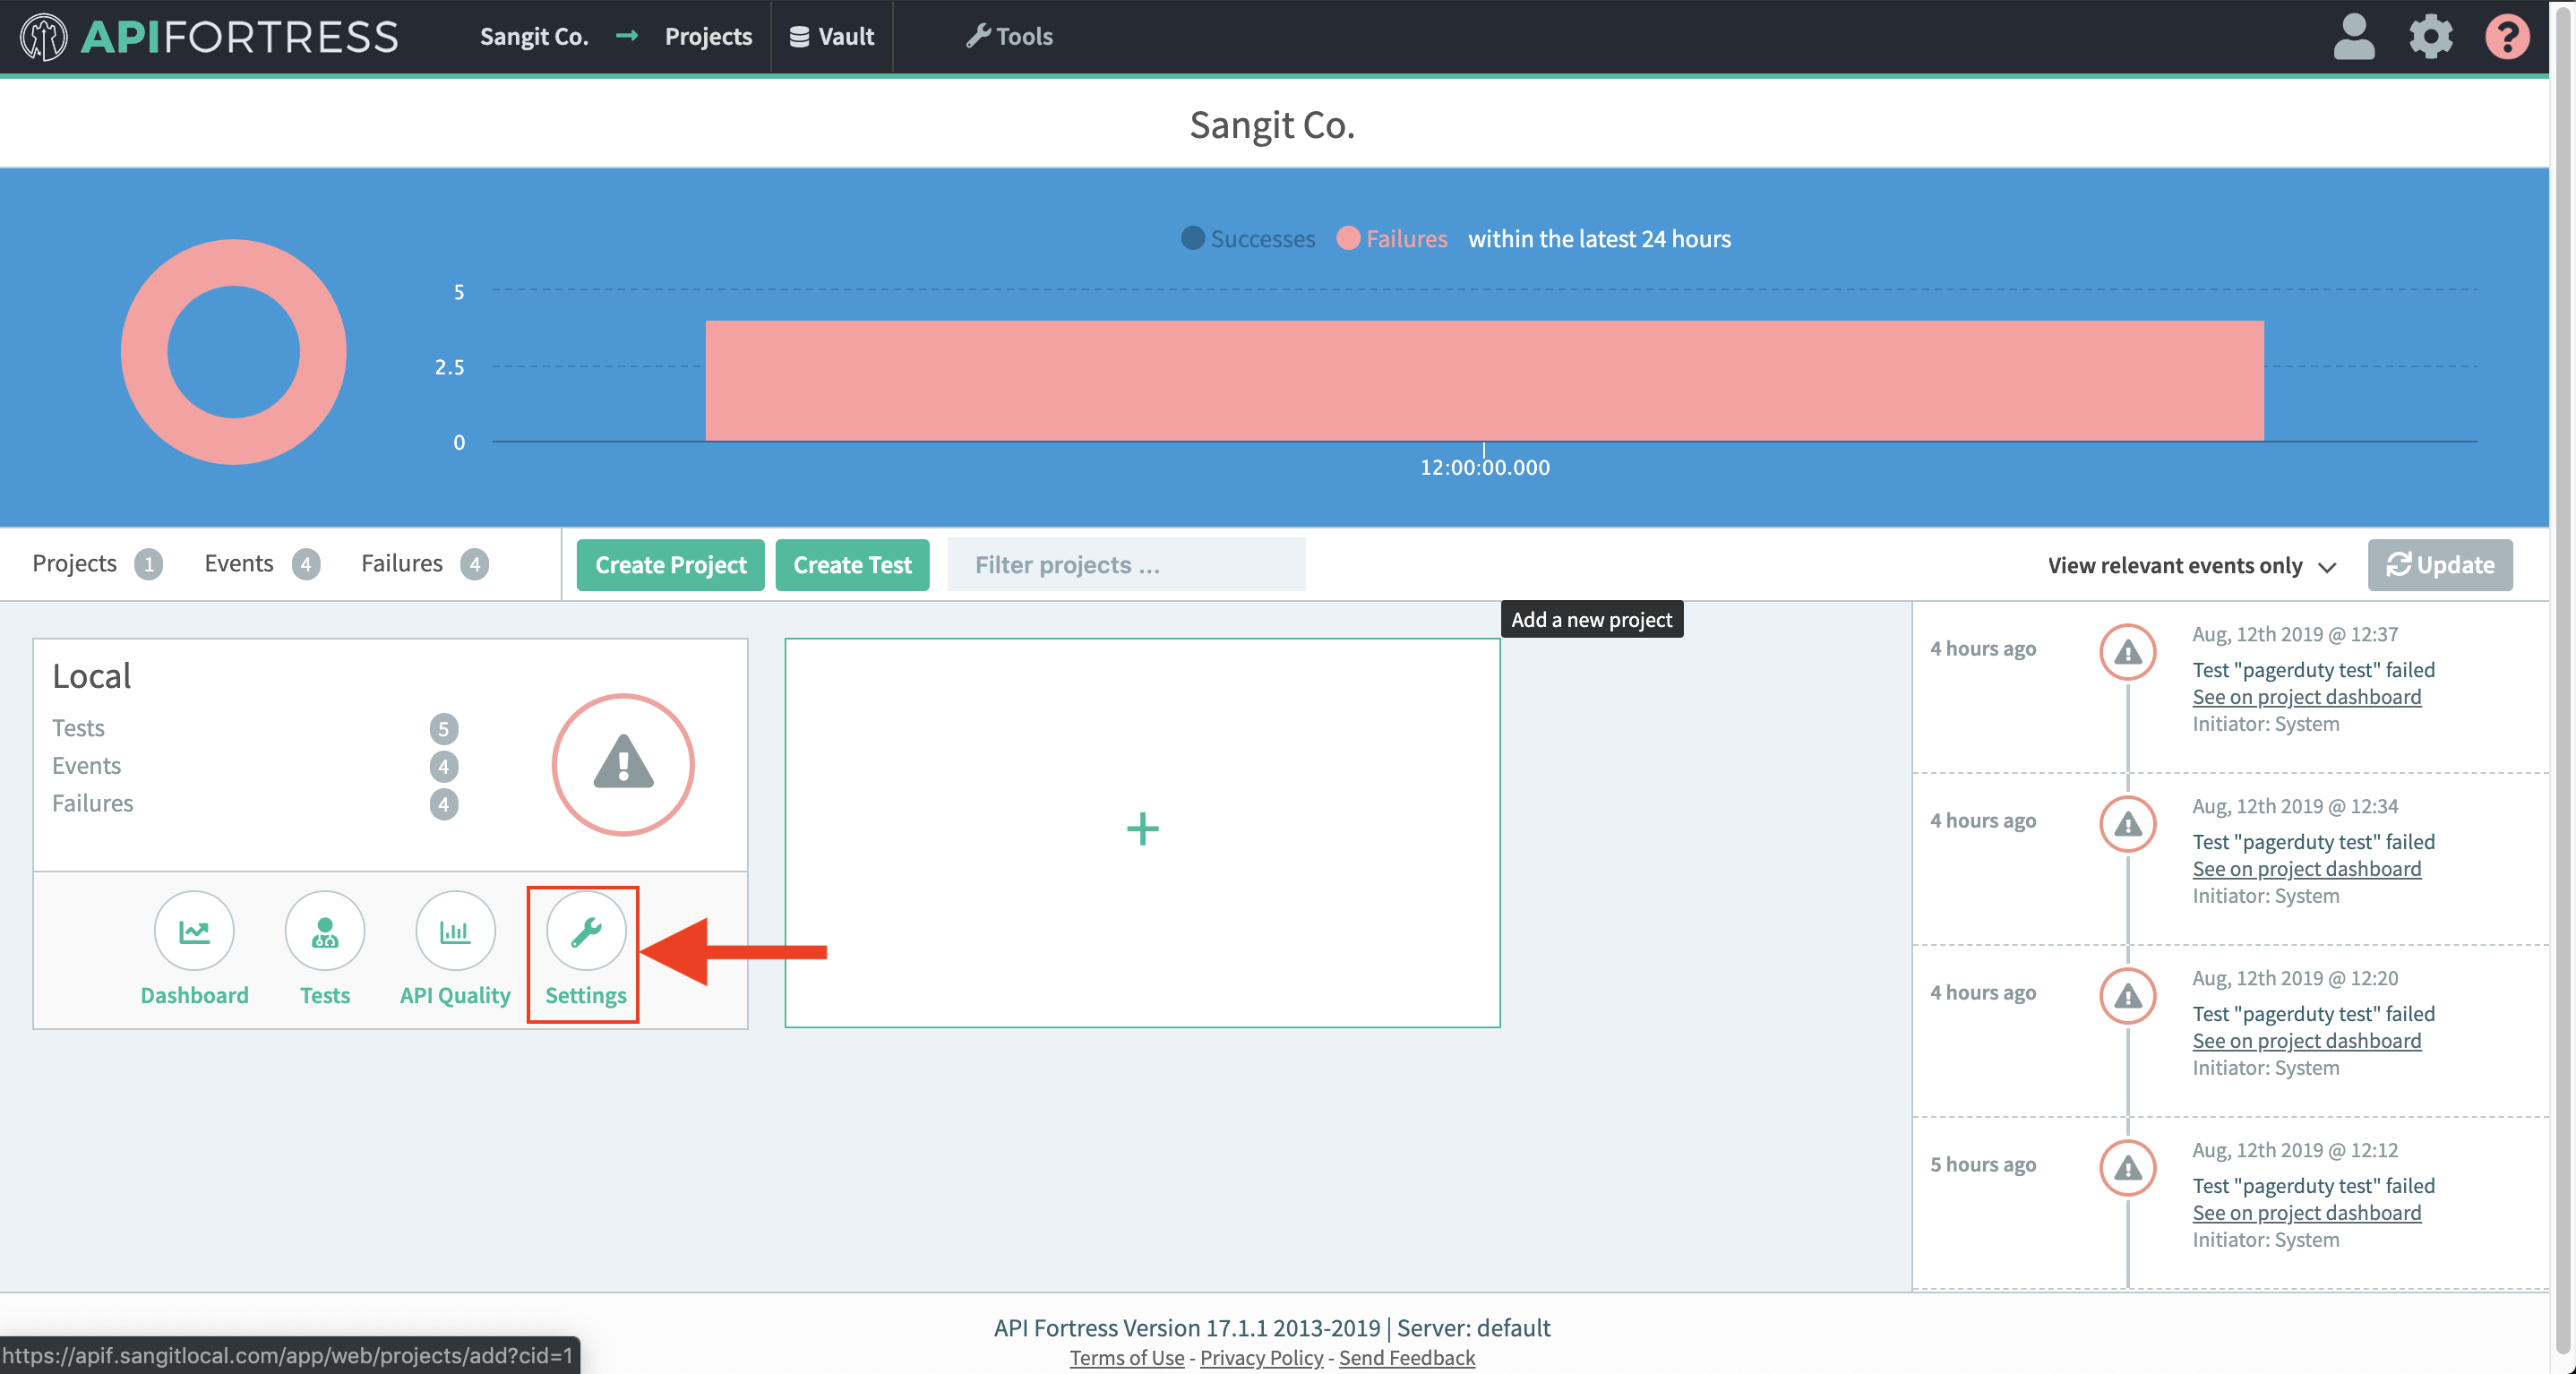
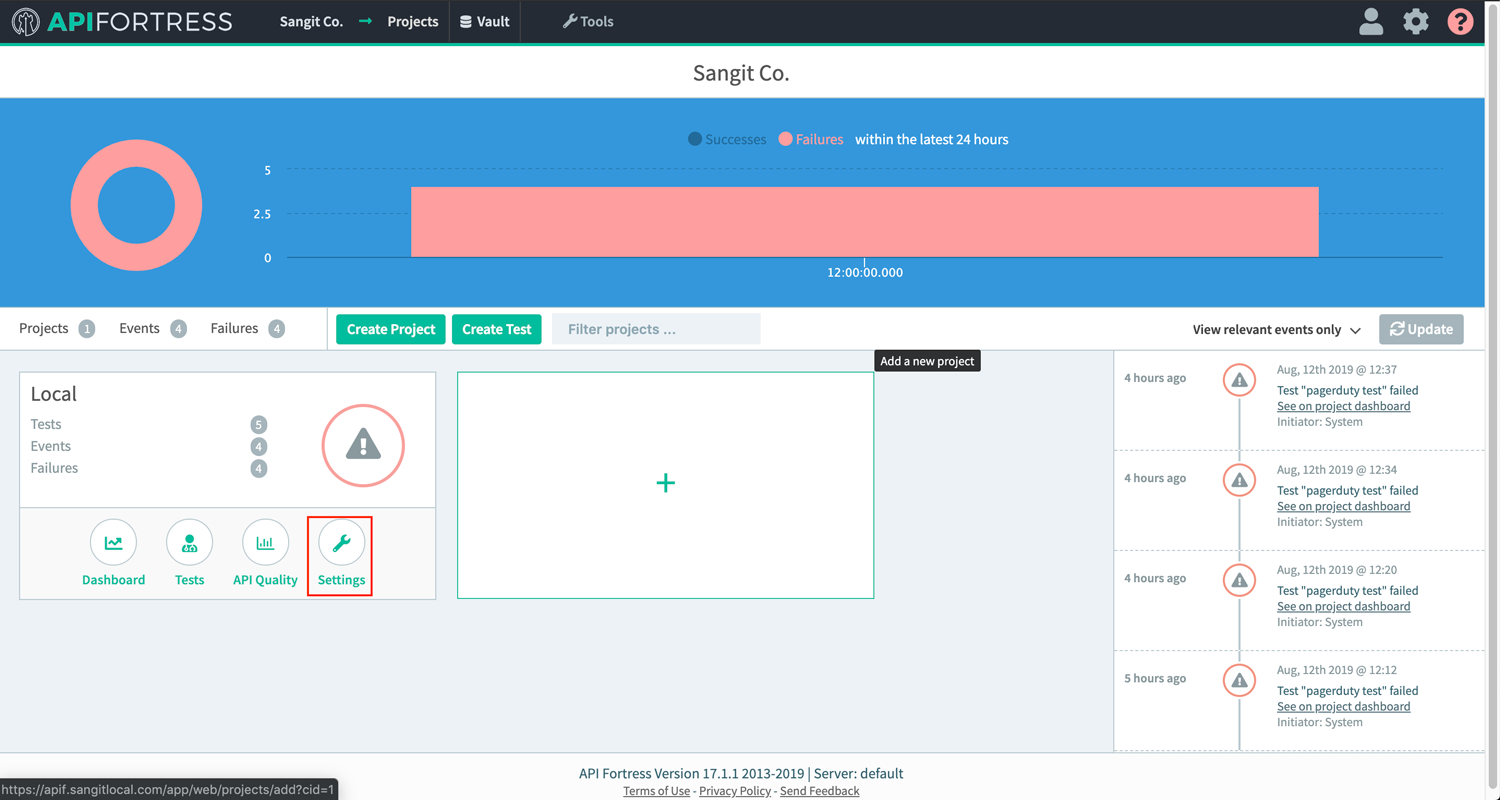
- Access the company dashboard by clicking the gear icon in the top right corner
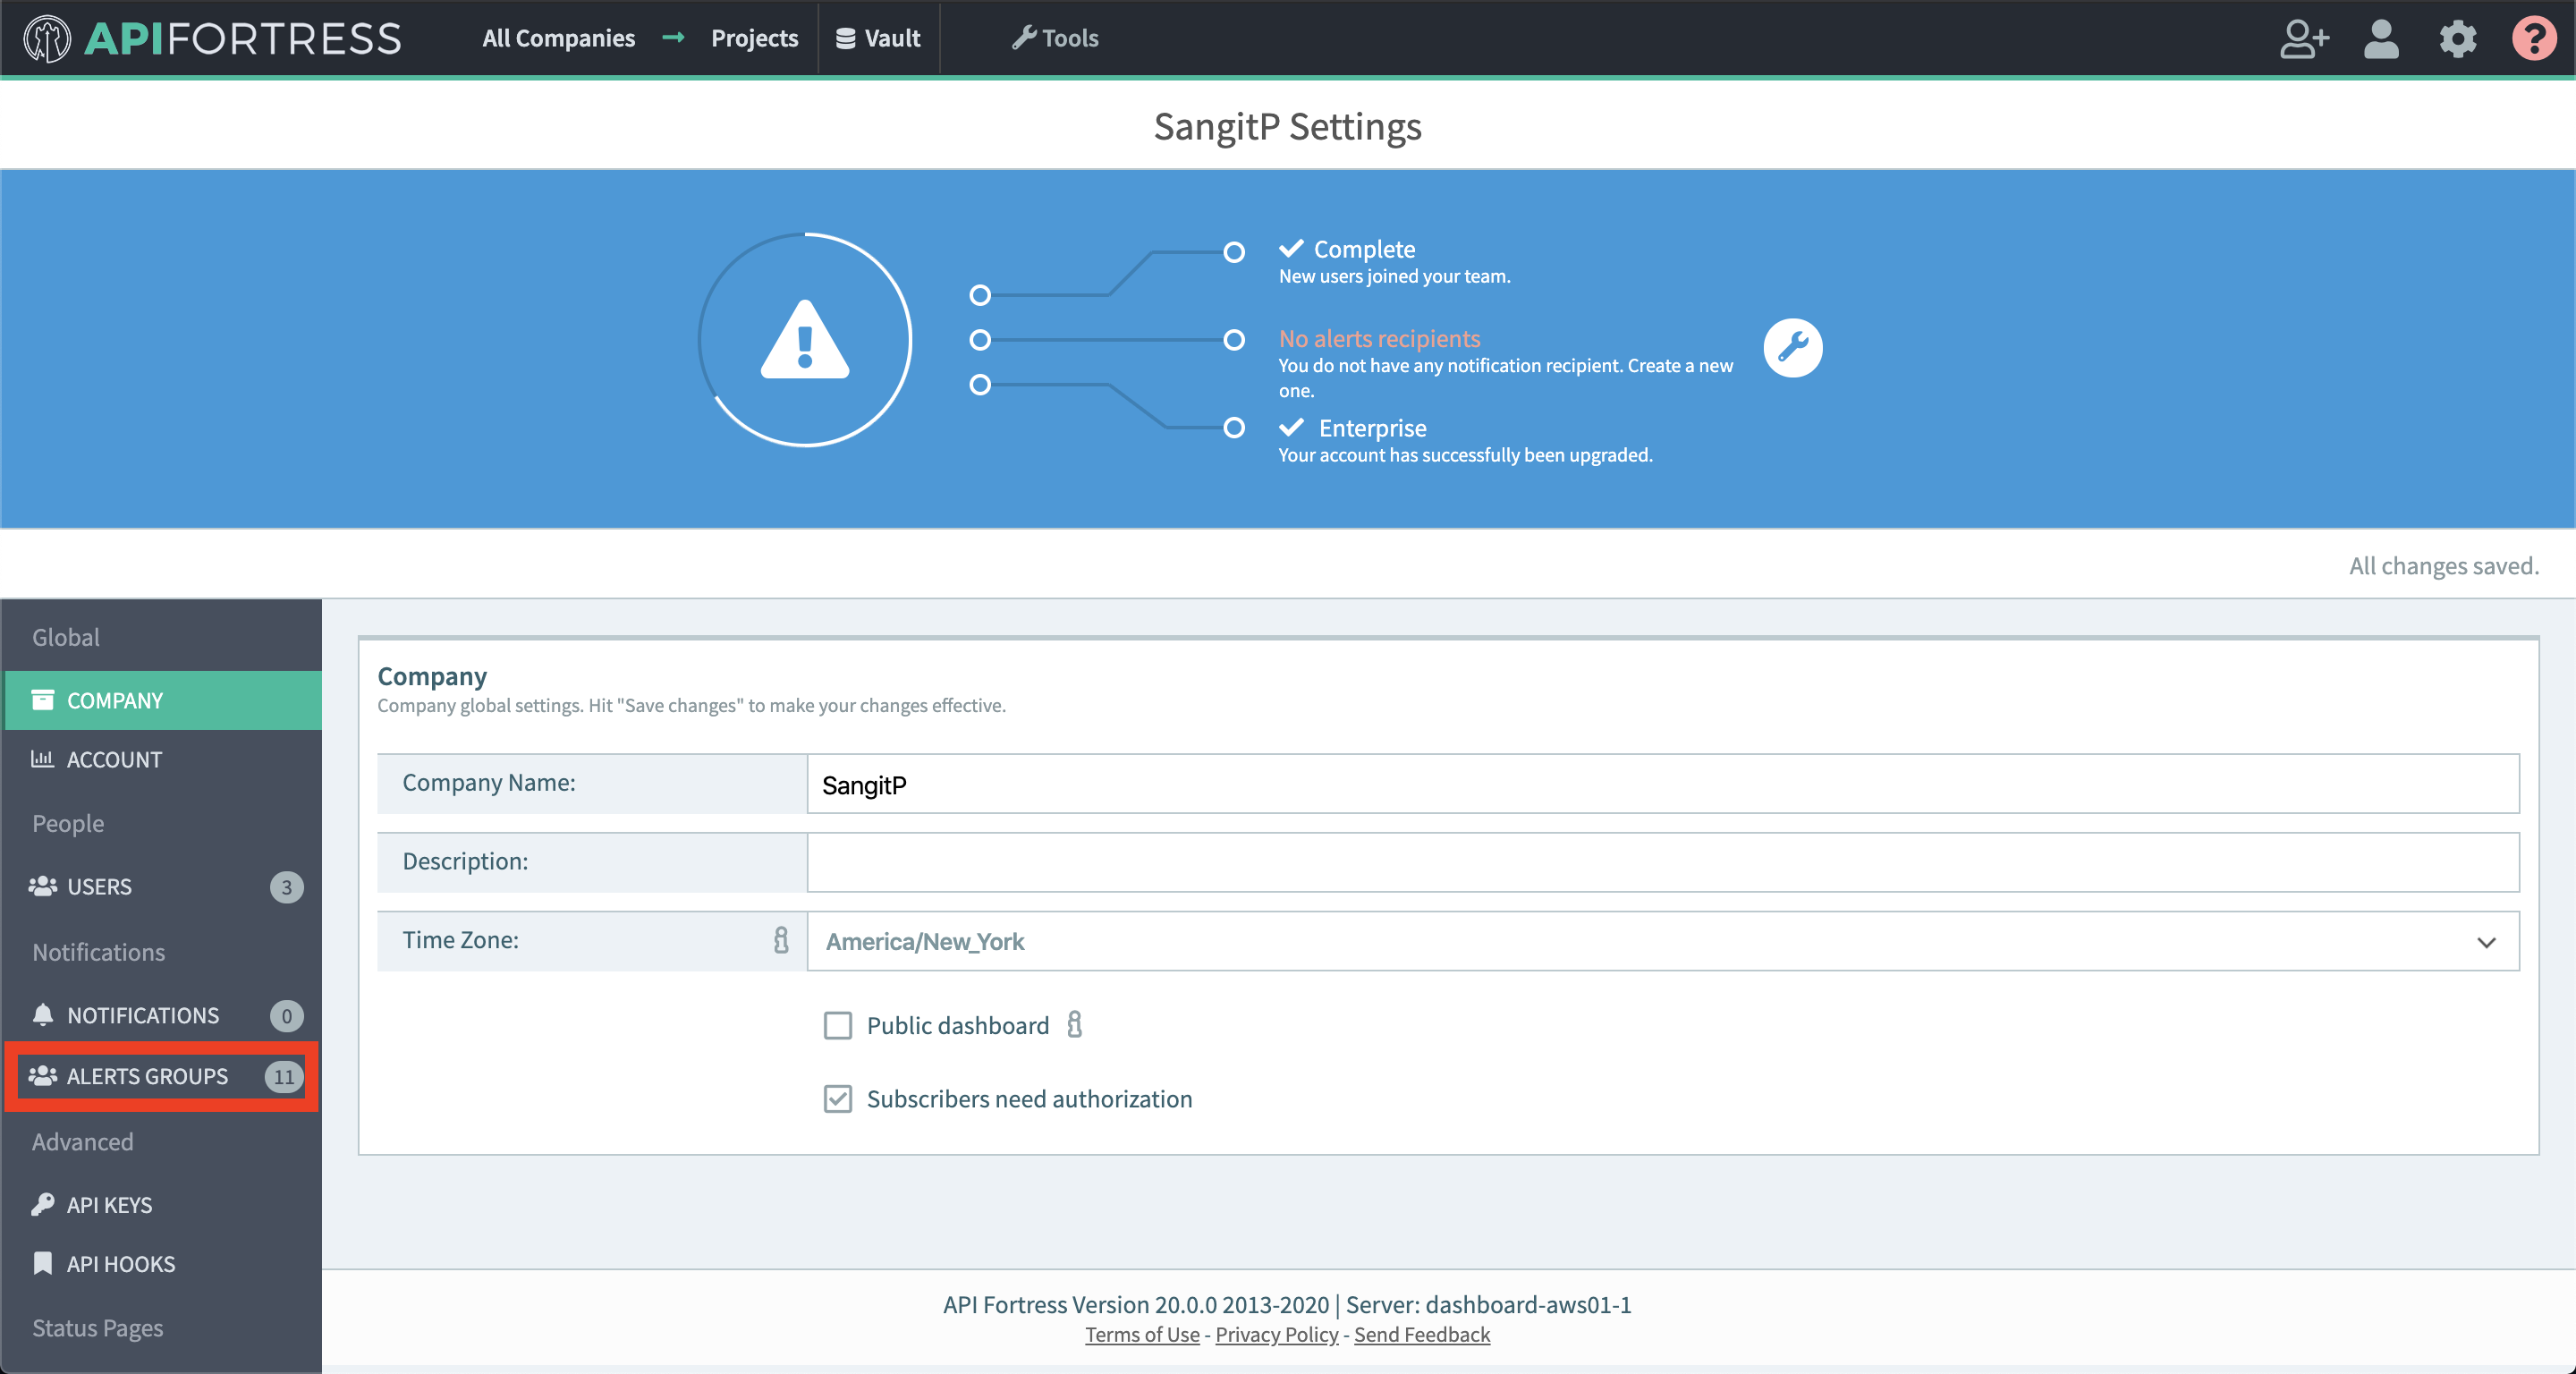
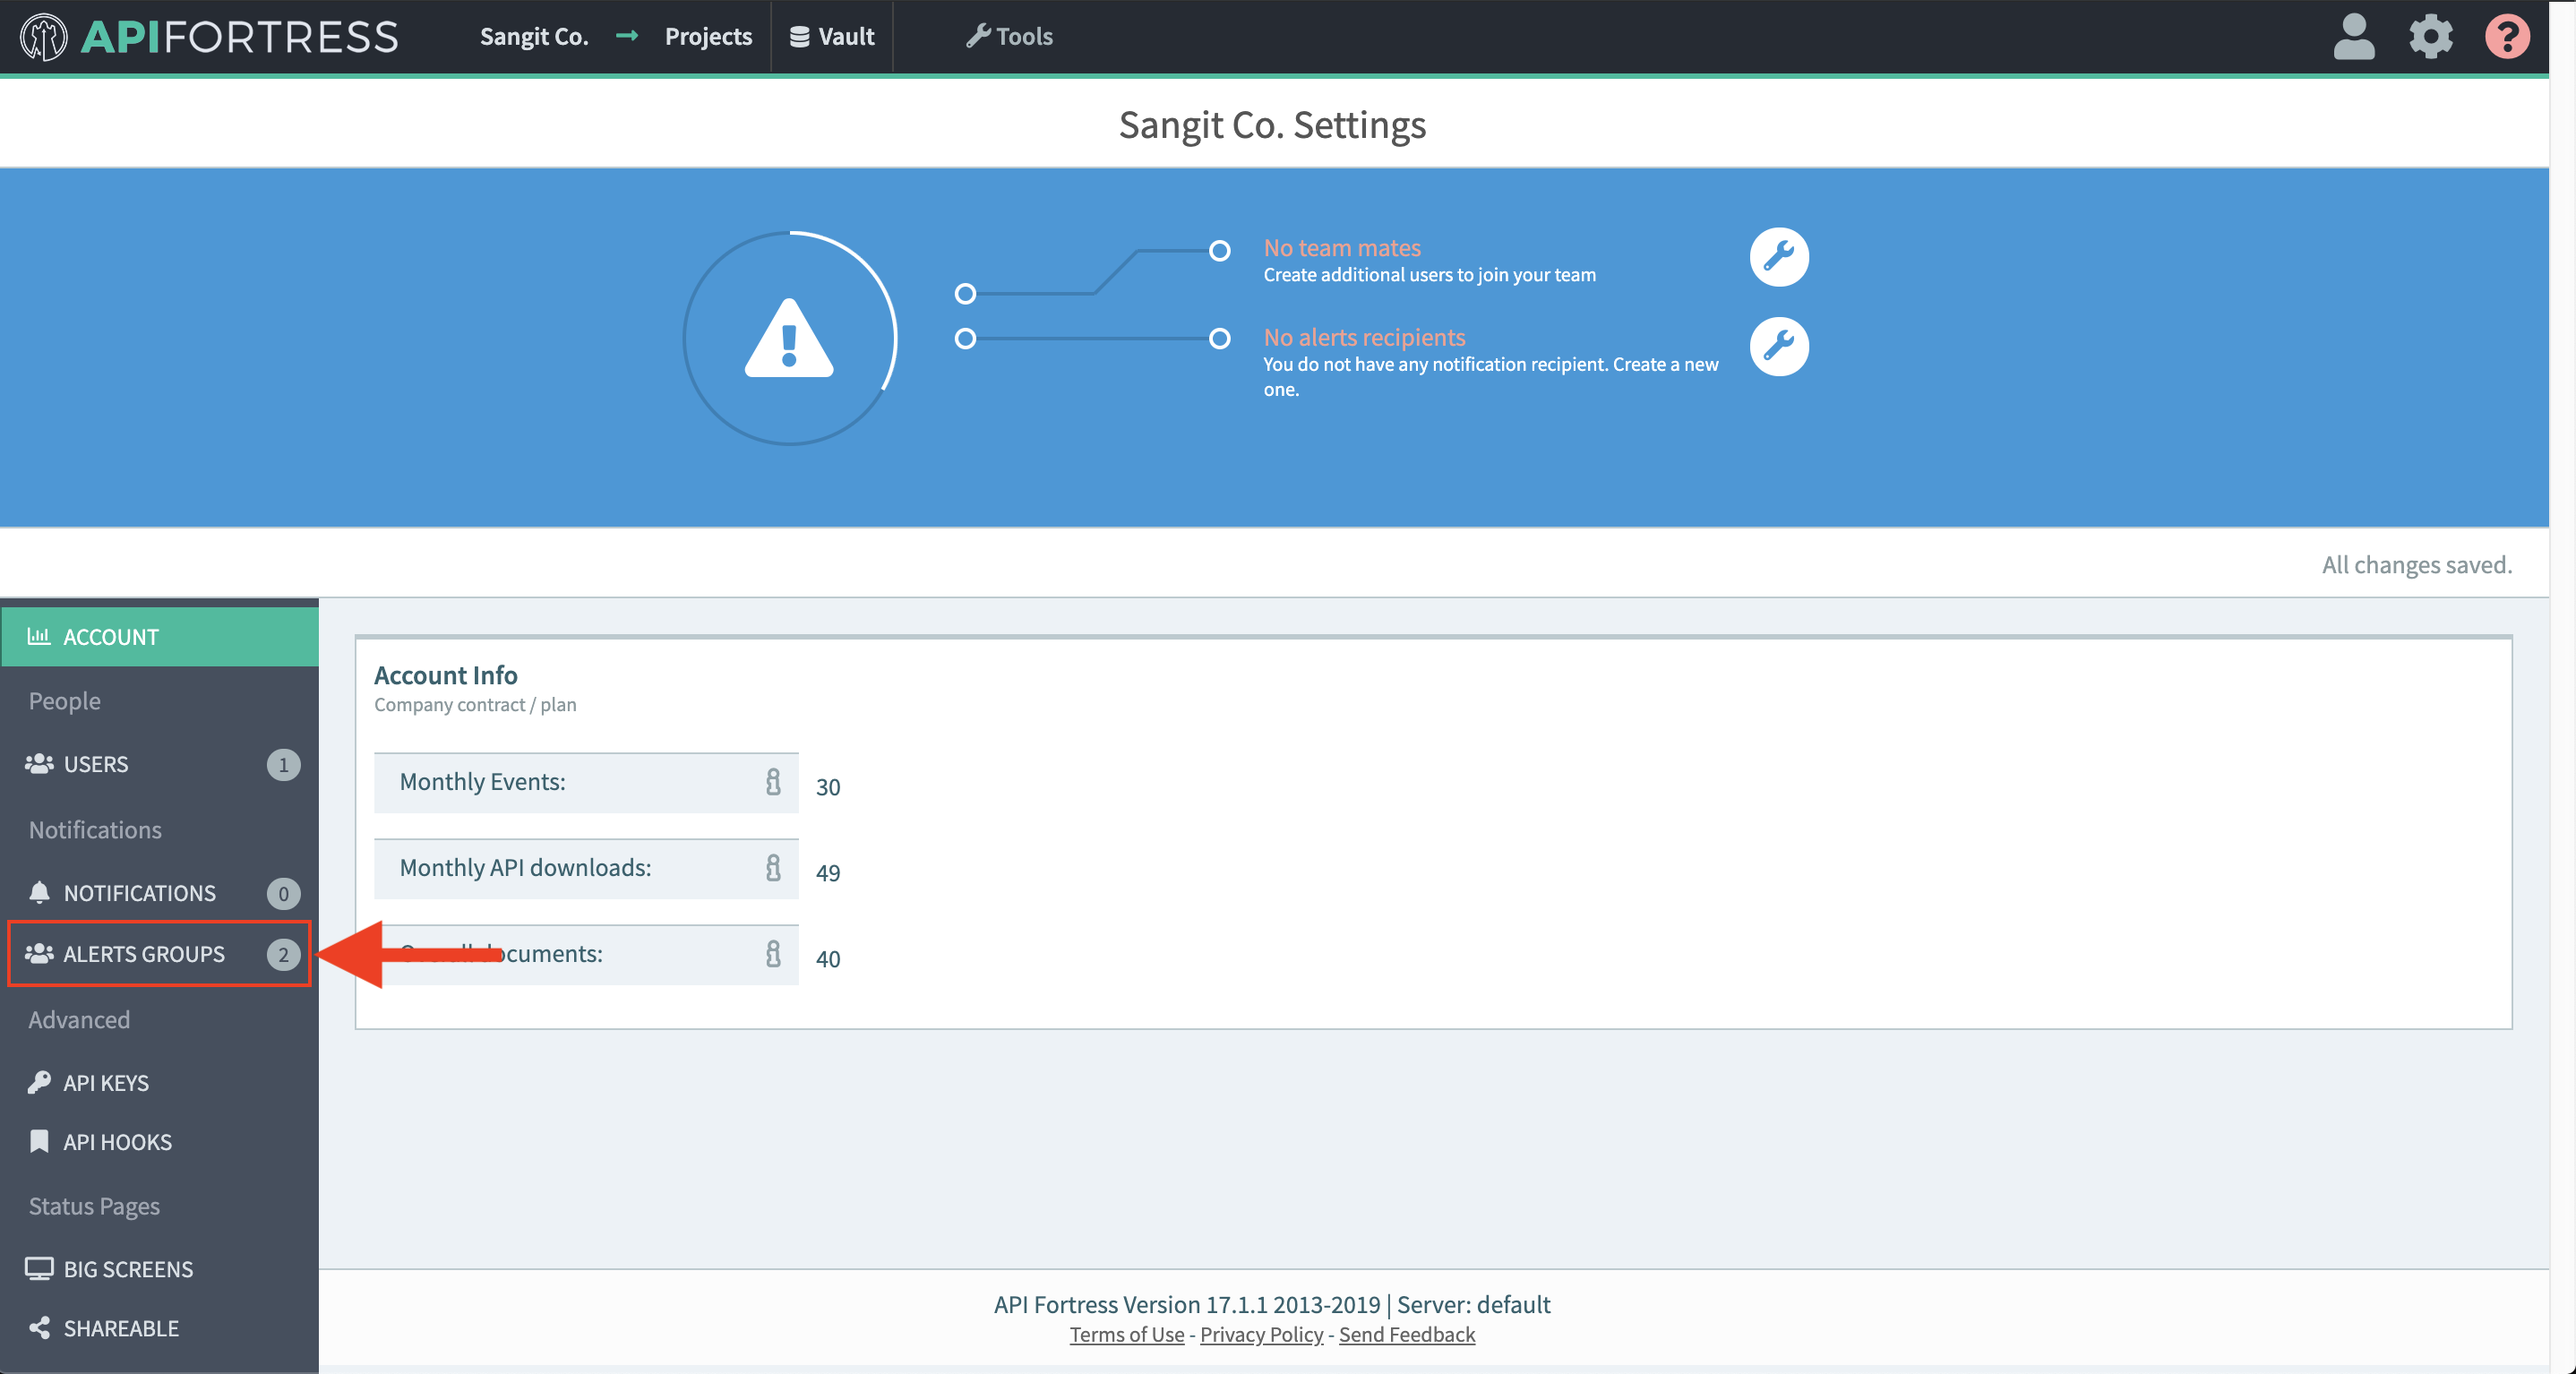
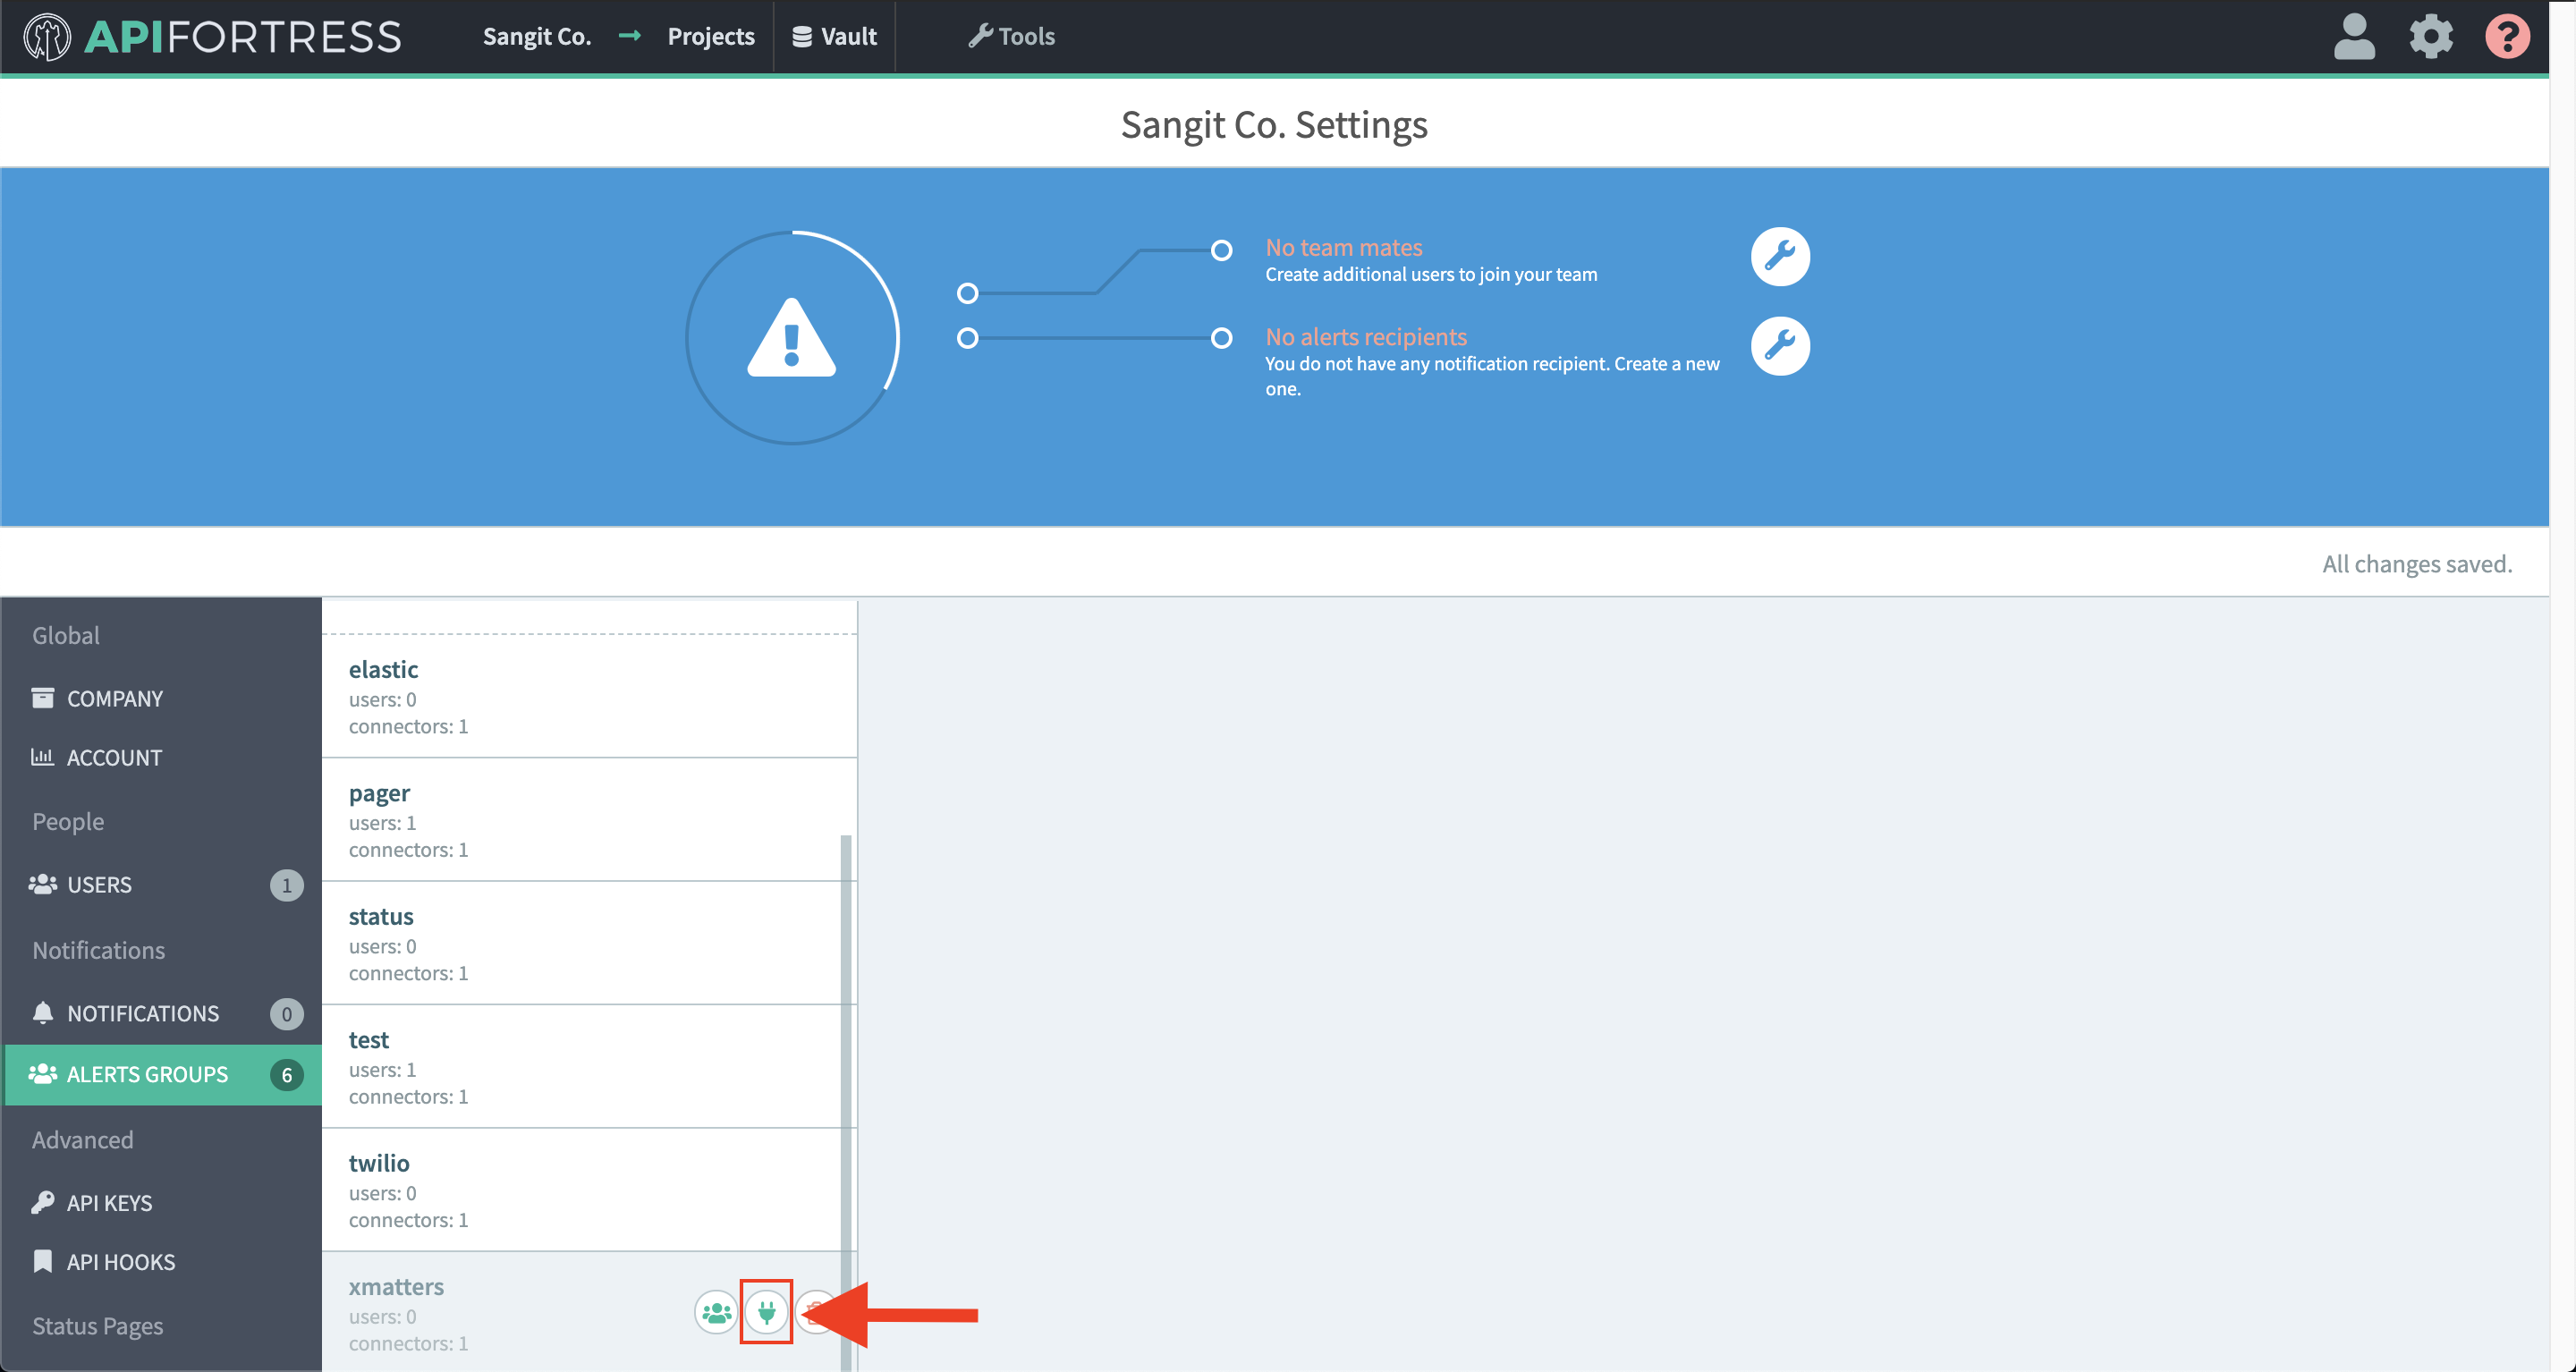
- Select “Alert groups”
- Create a new alert group if you don’t have already one for this purpose
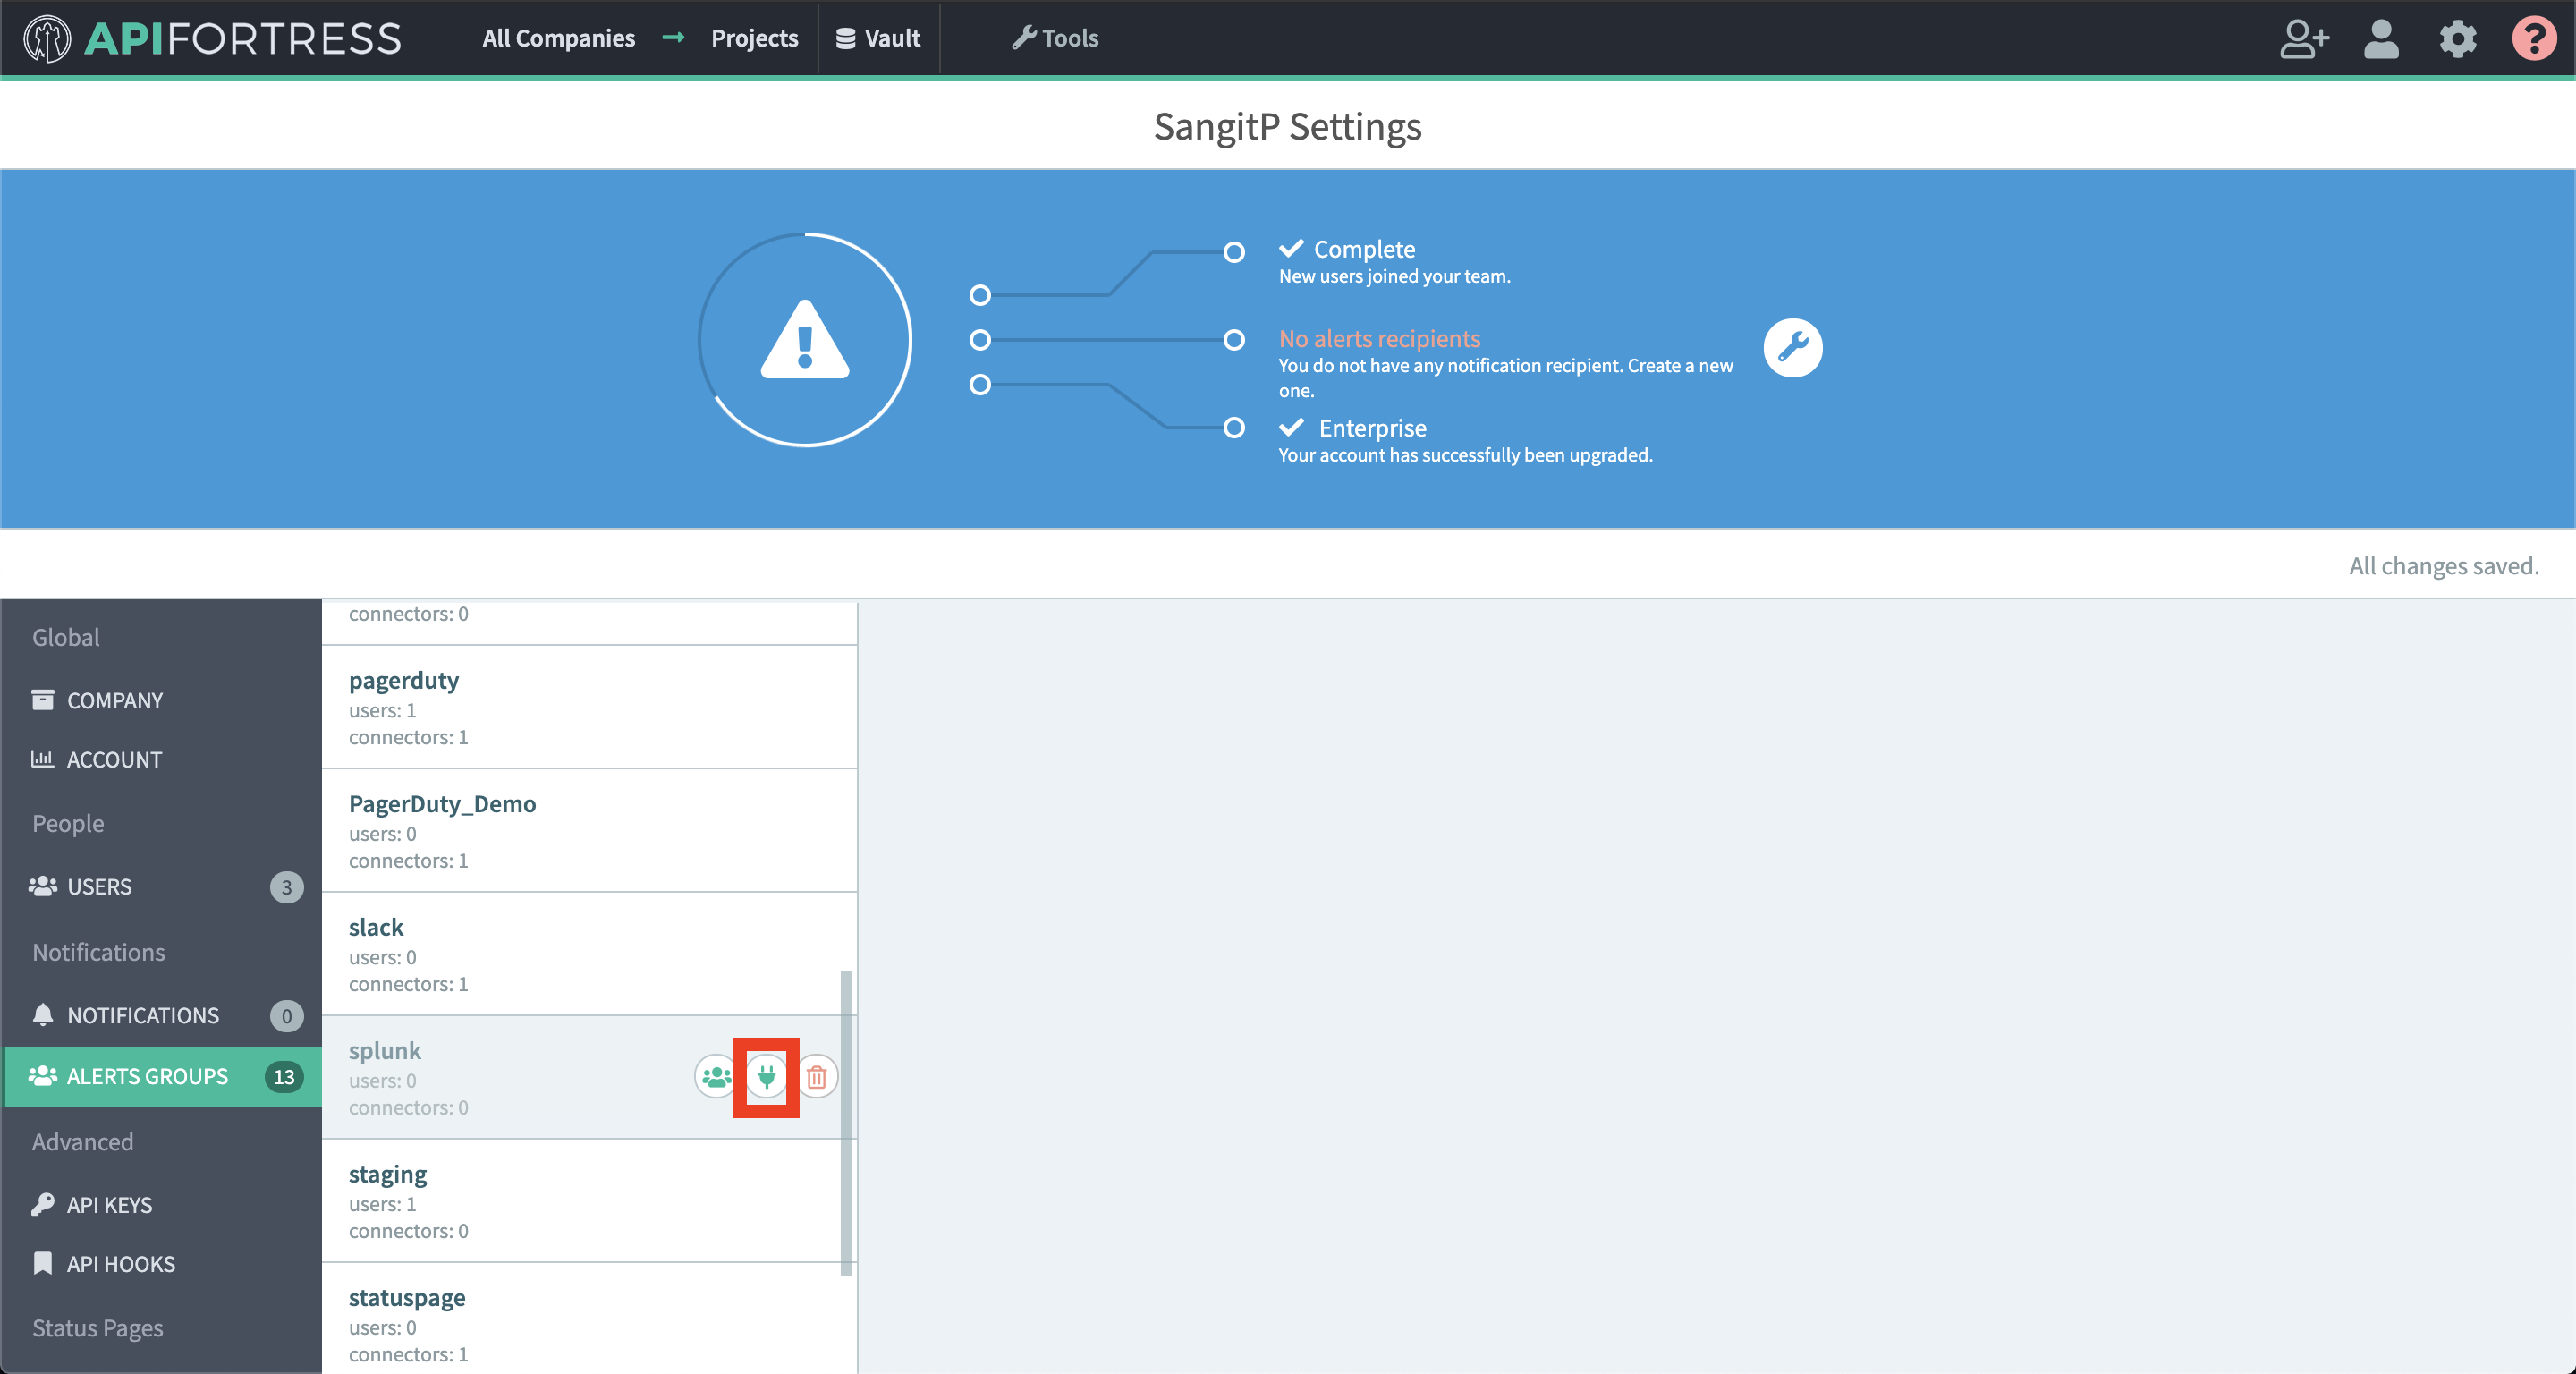
- Select the socket icon
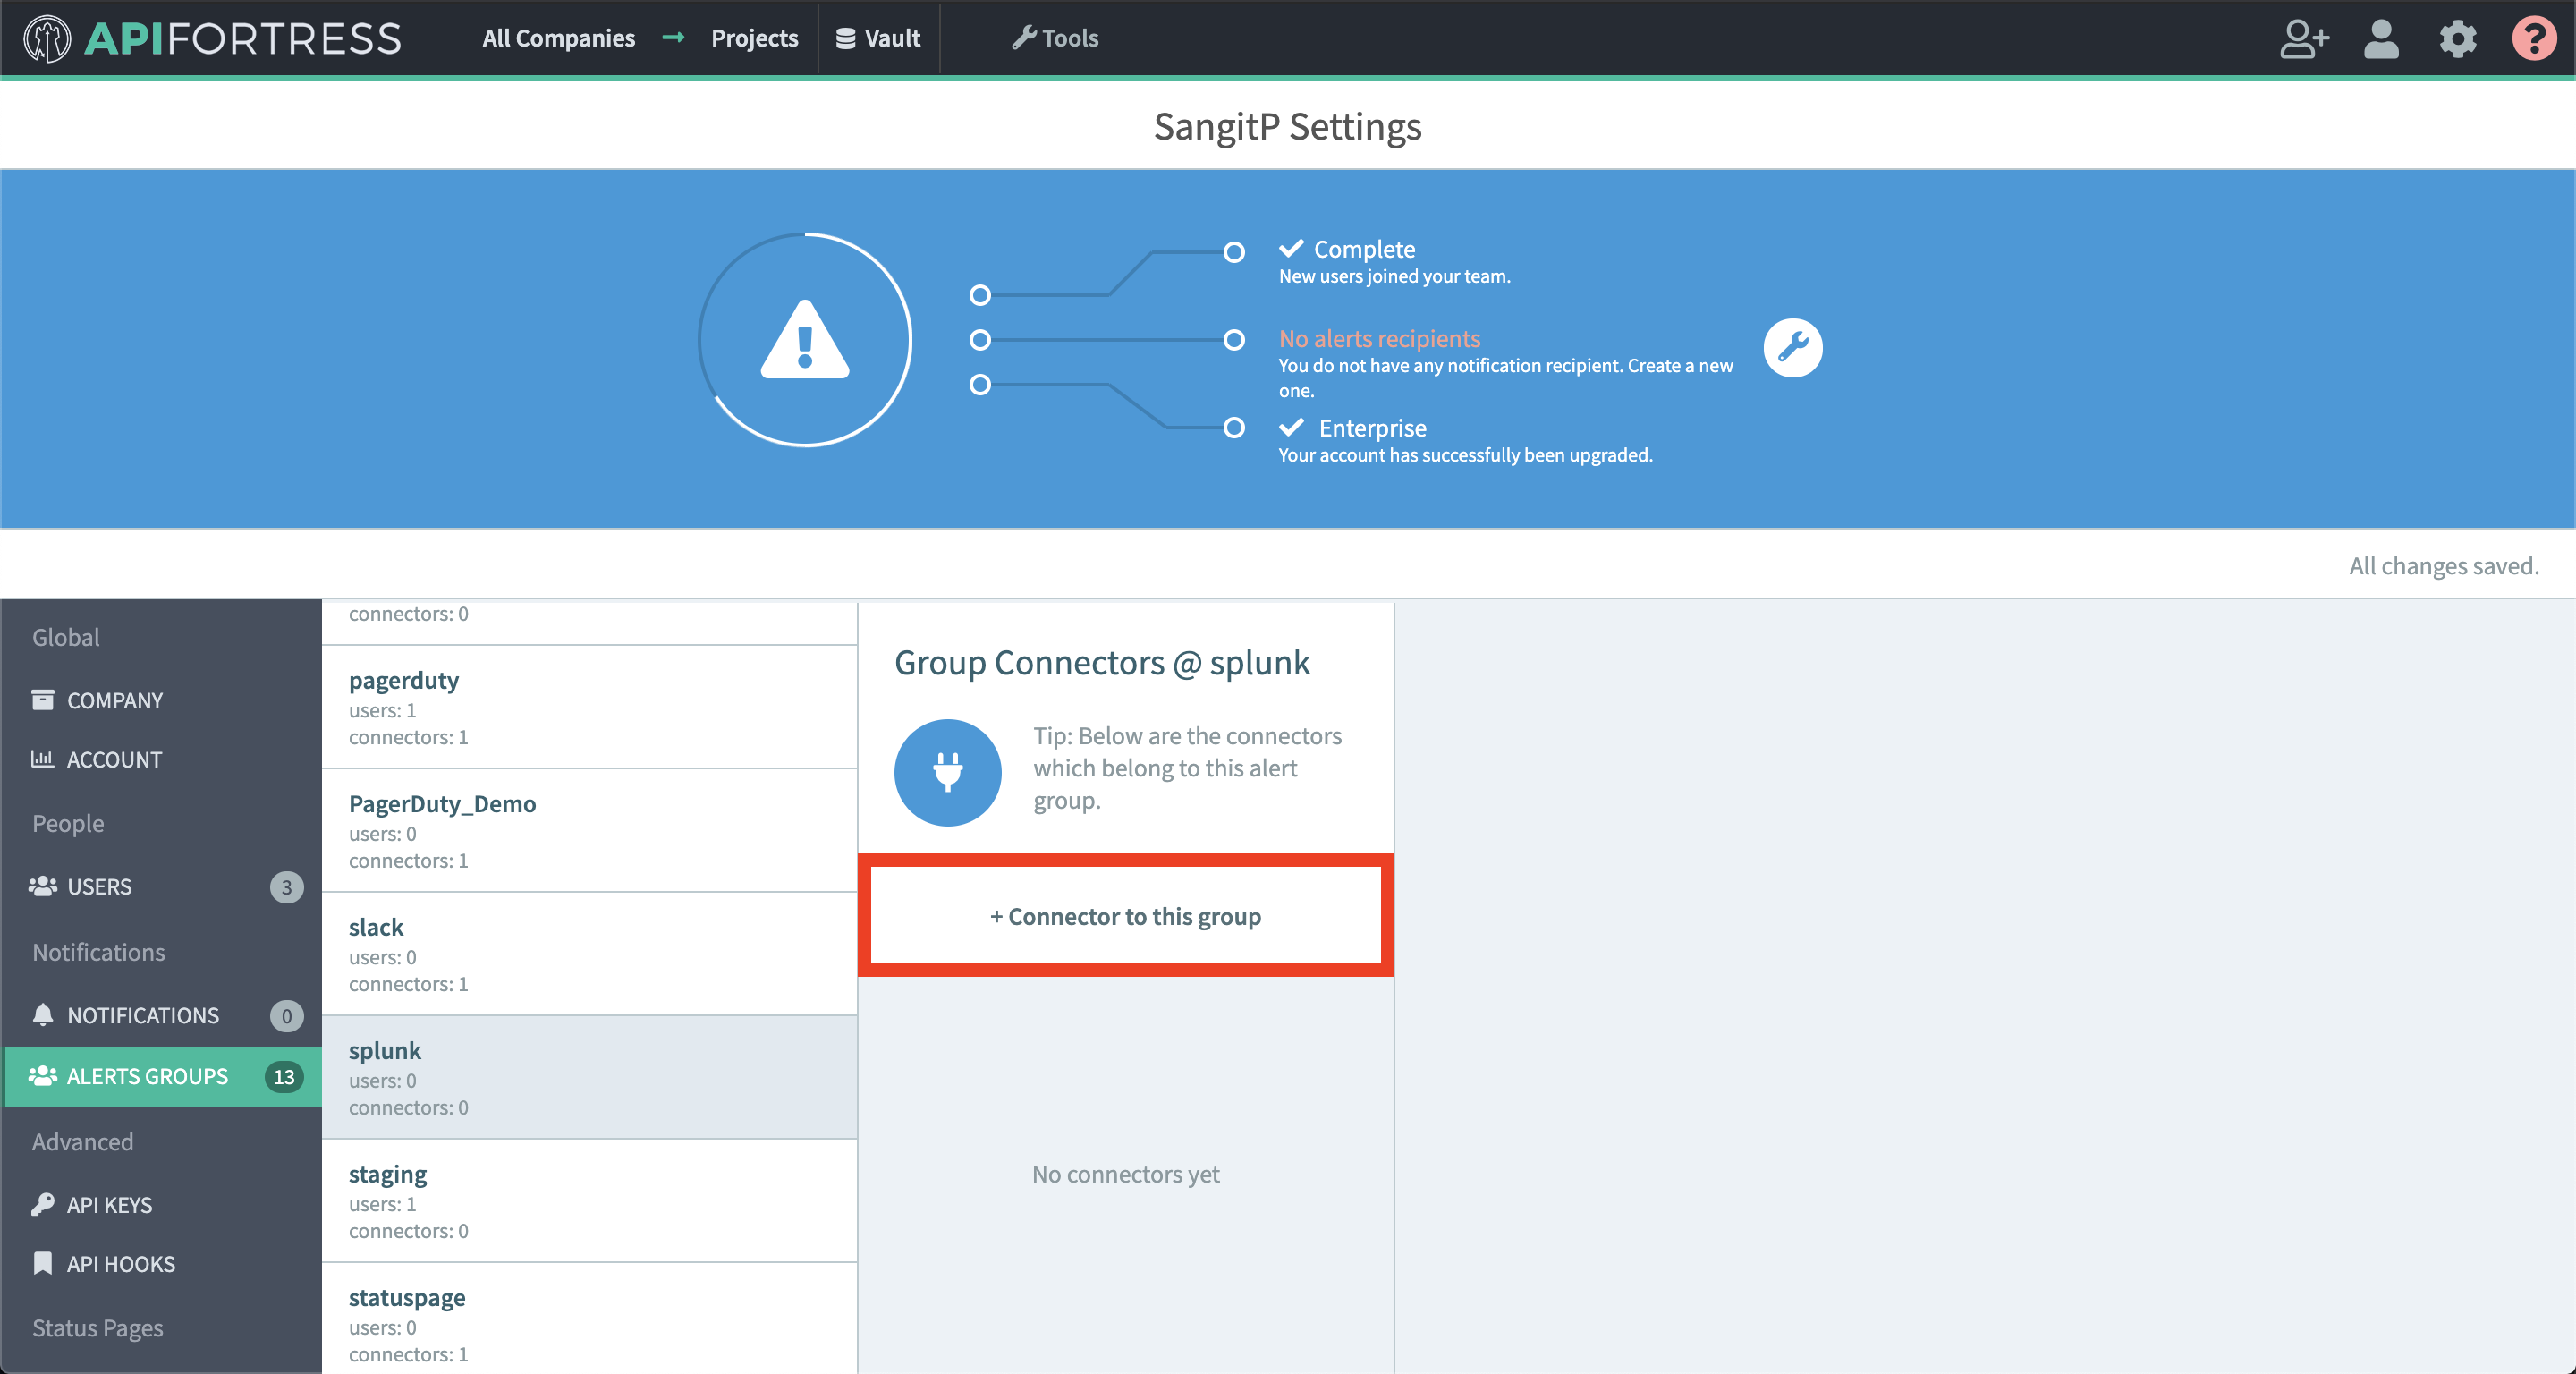
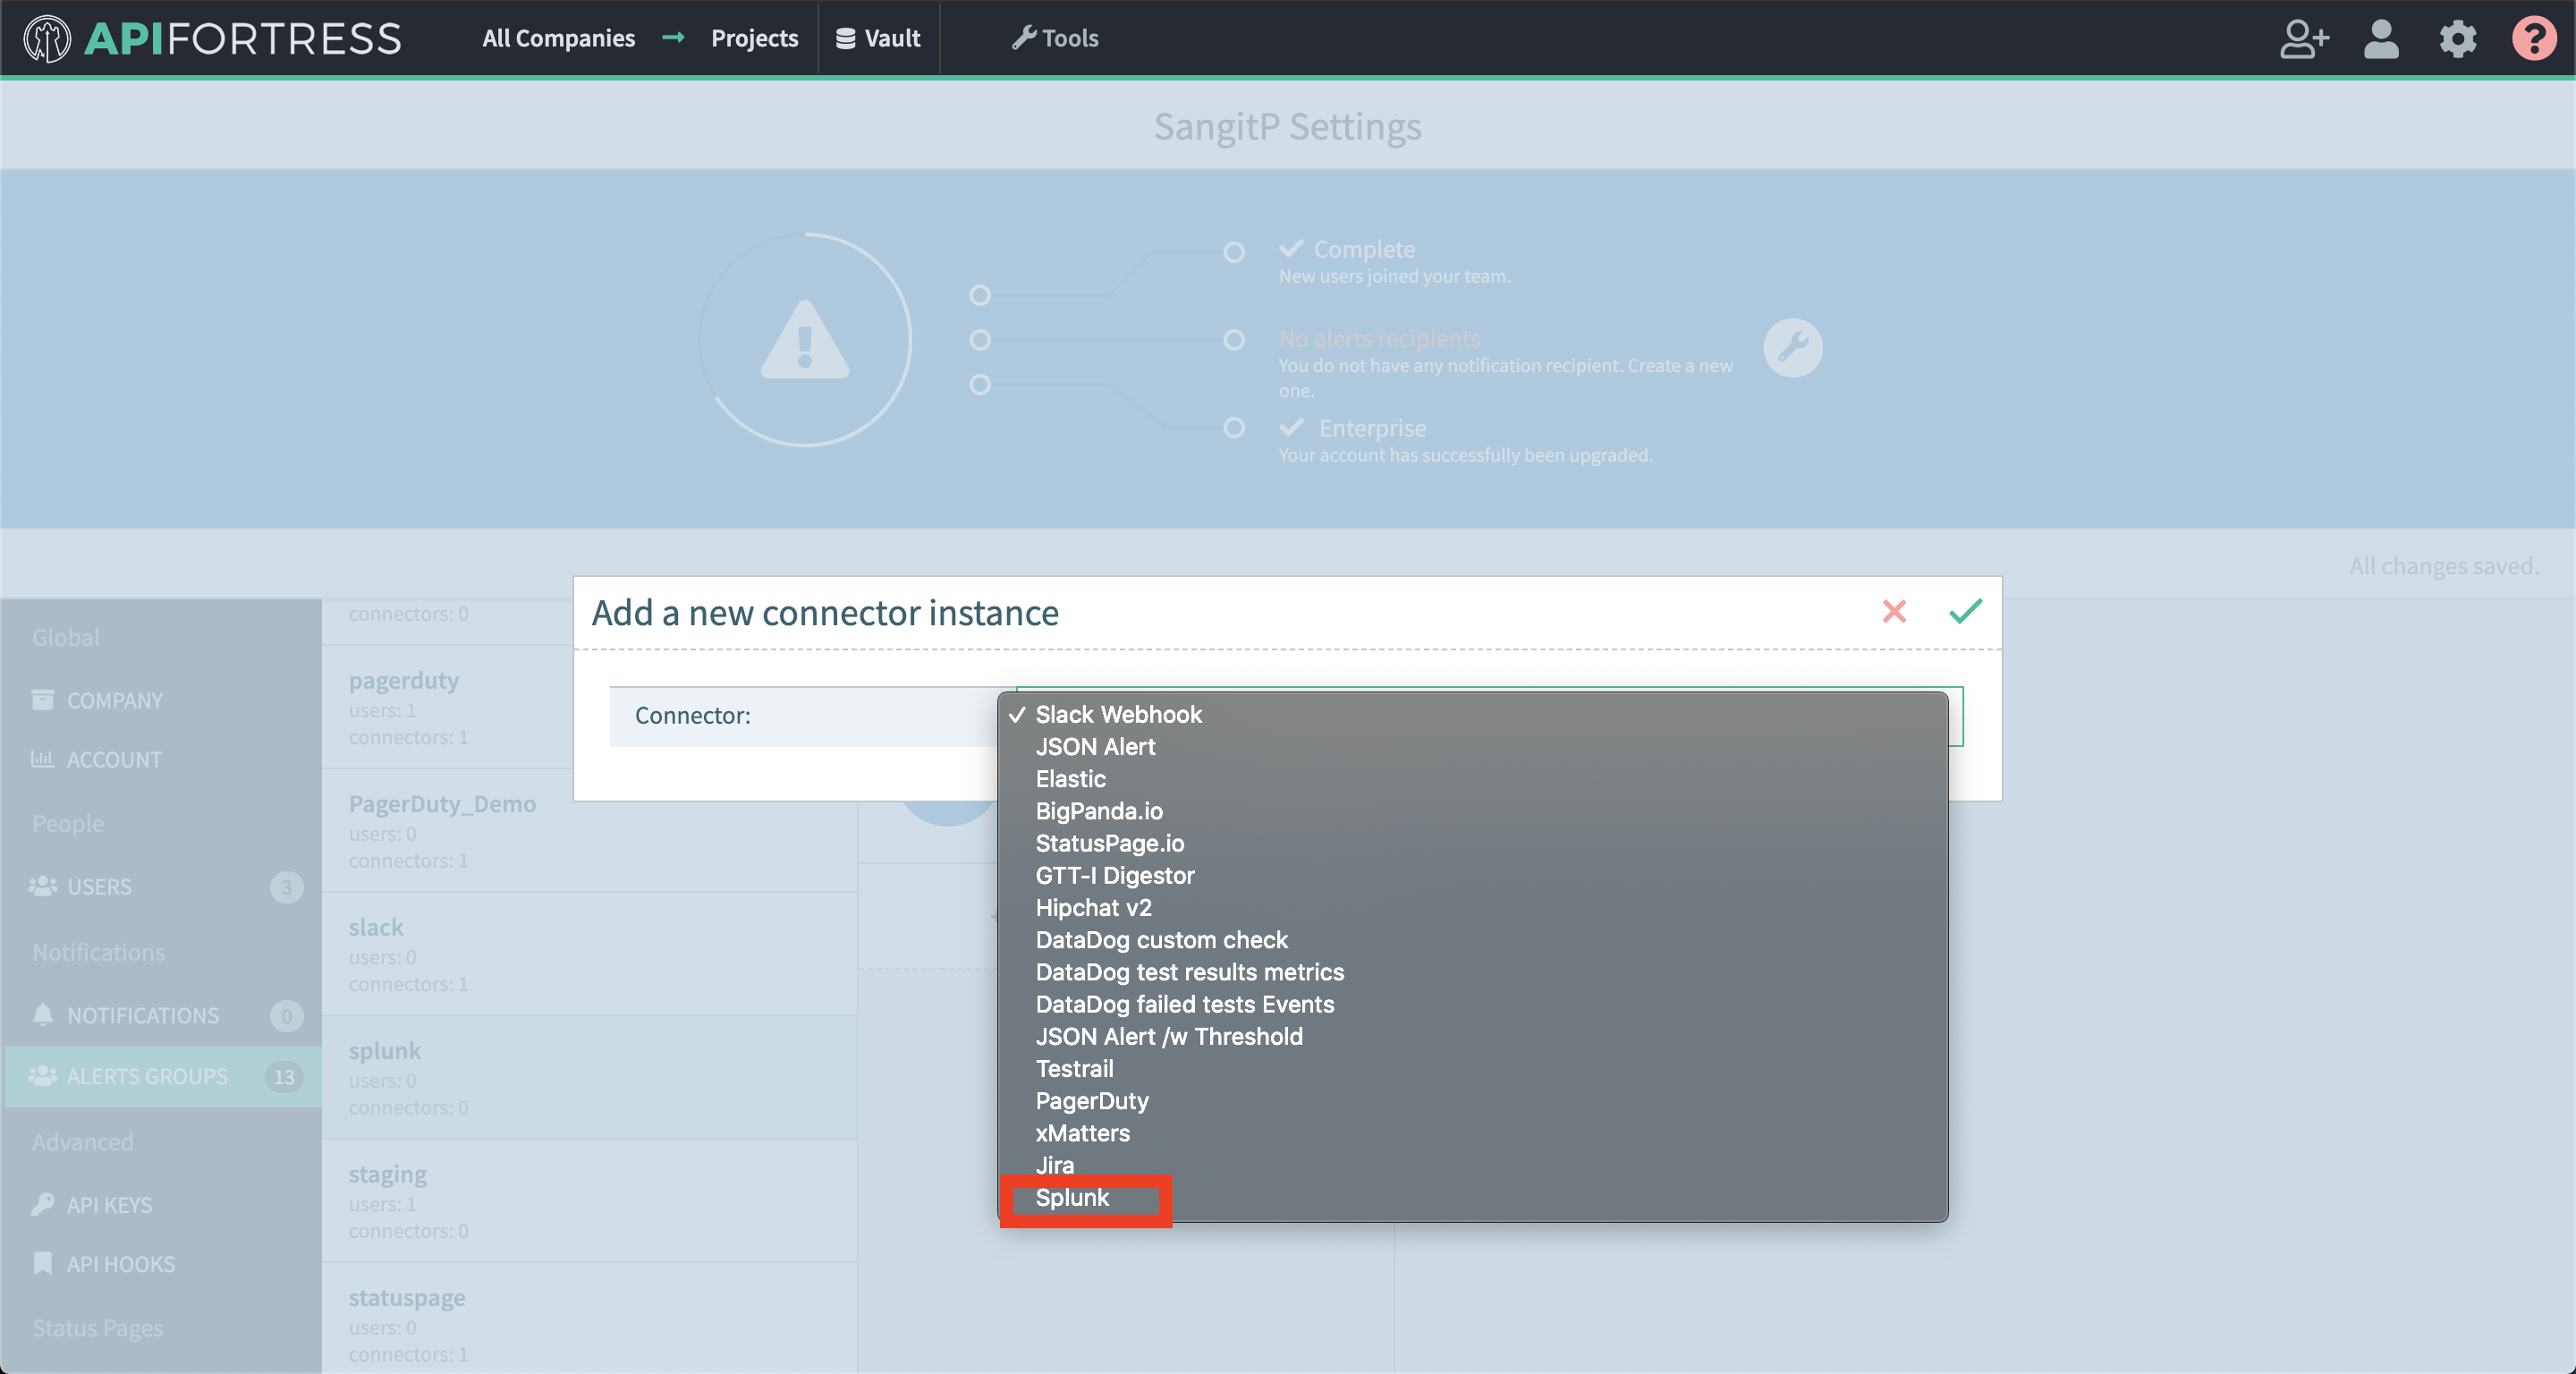
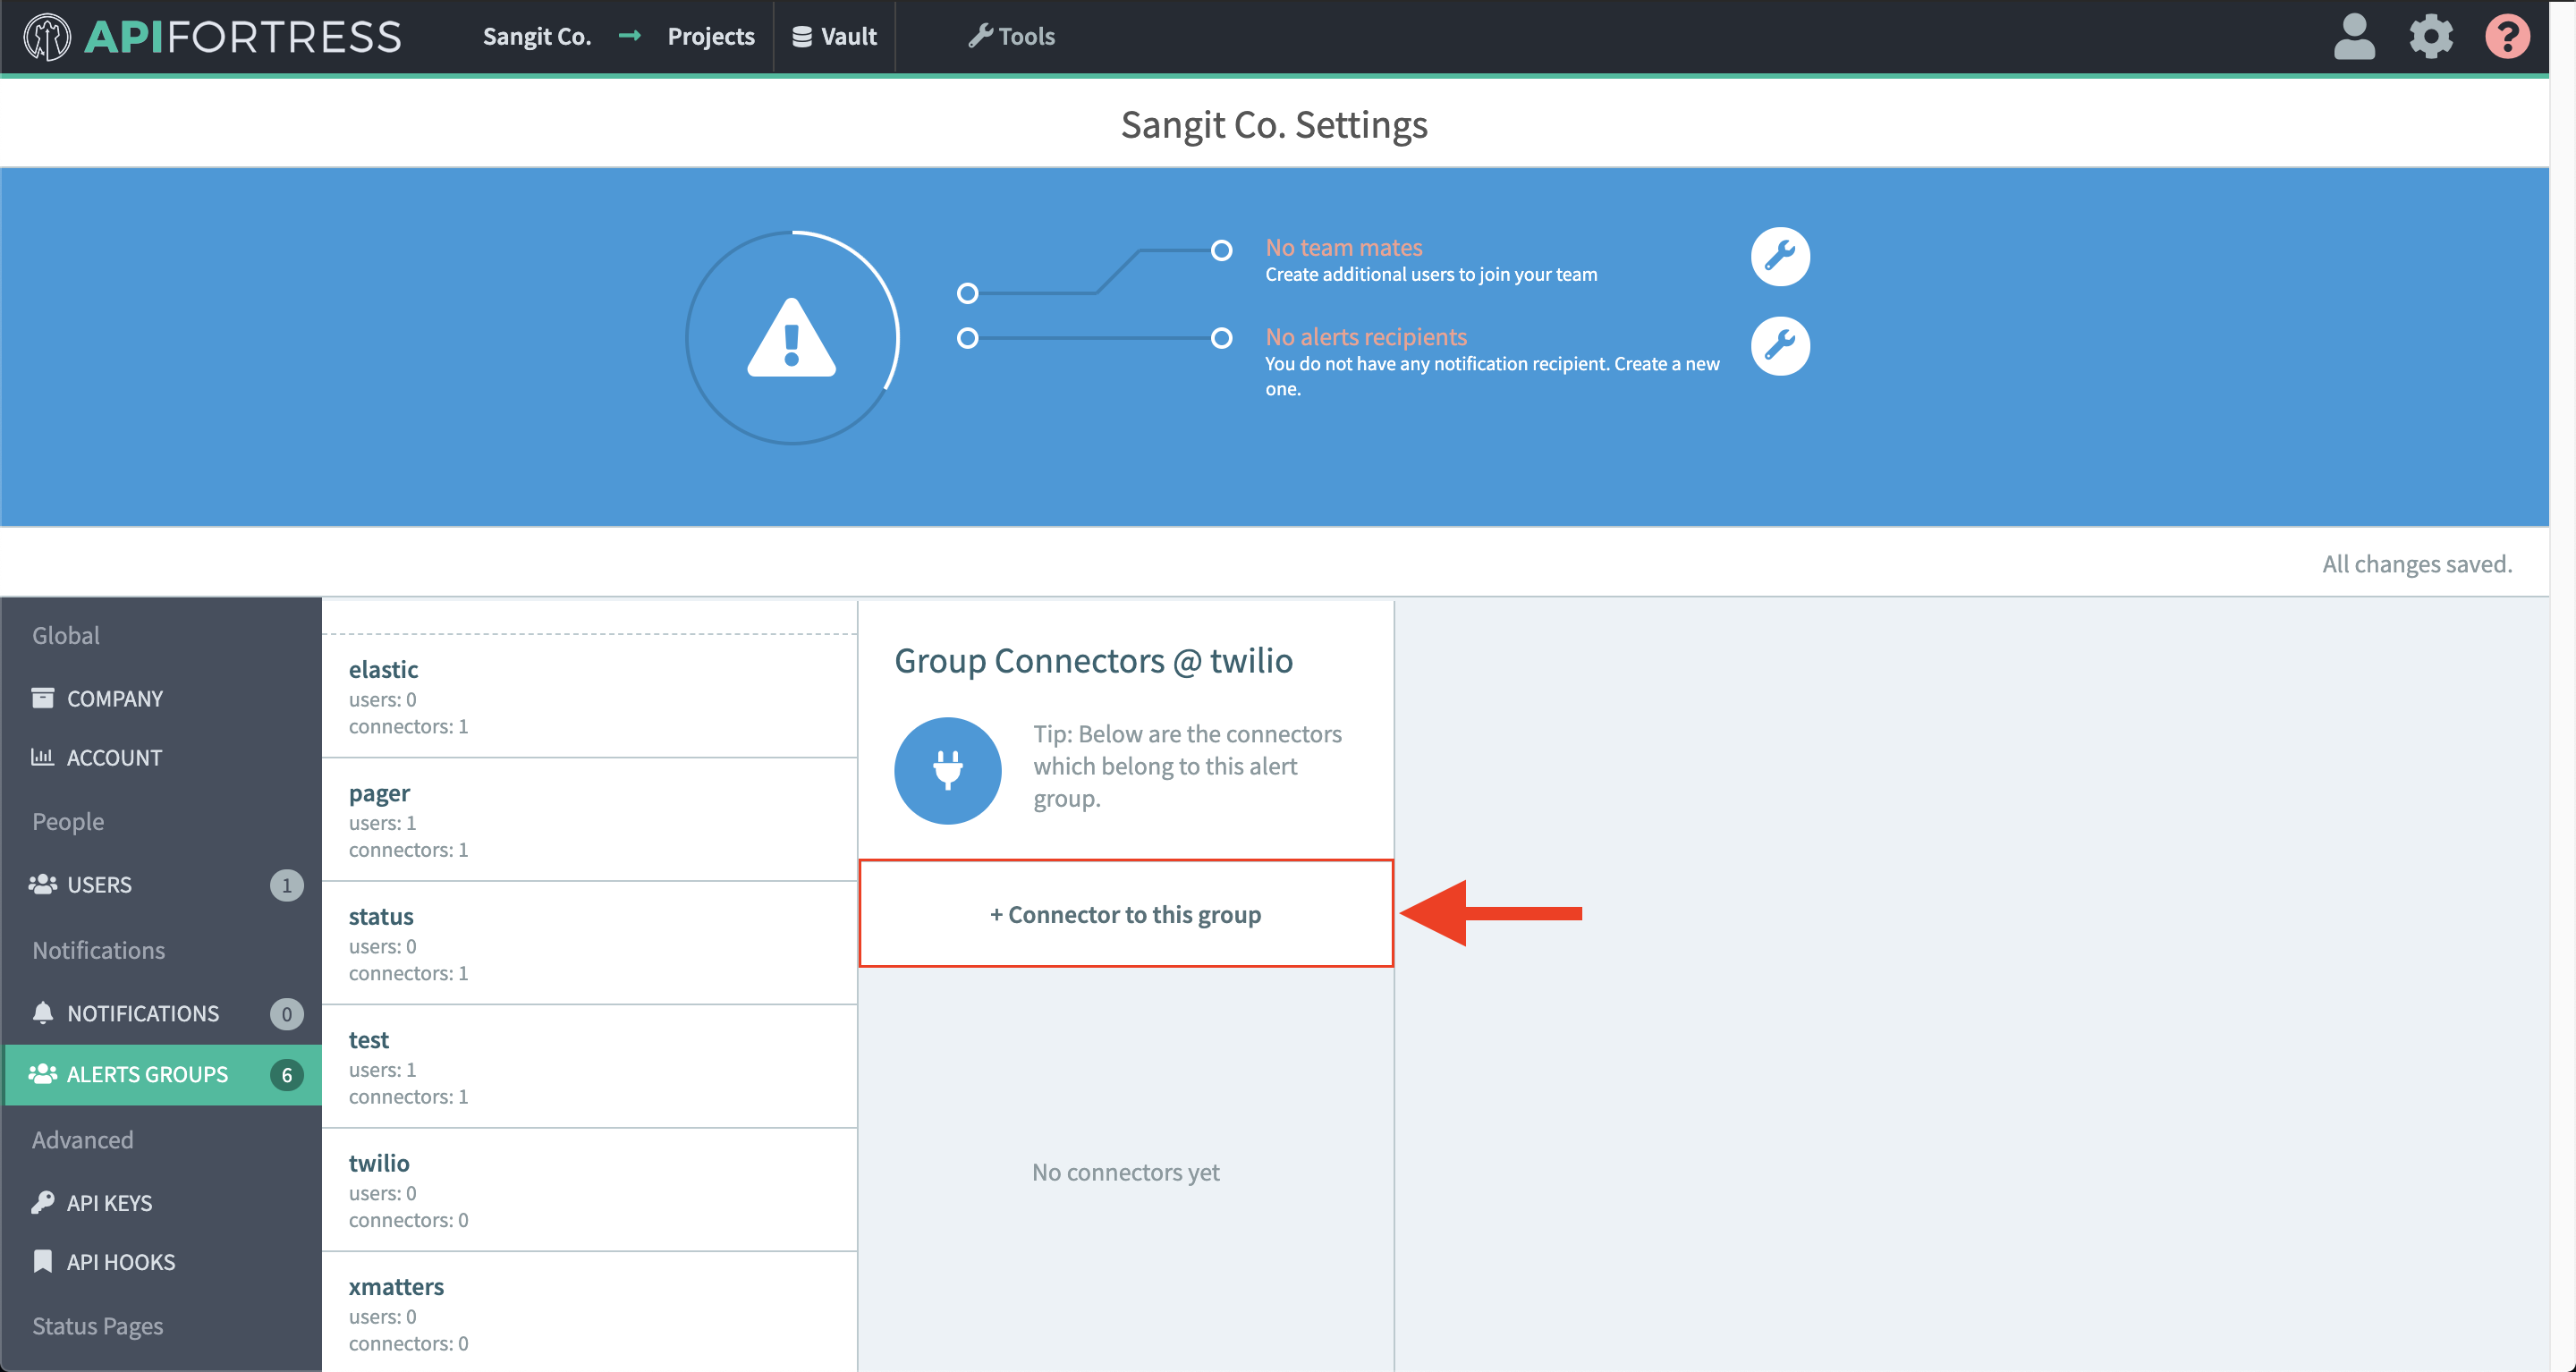
- Select “+ Connector to this group”
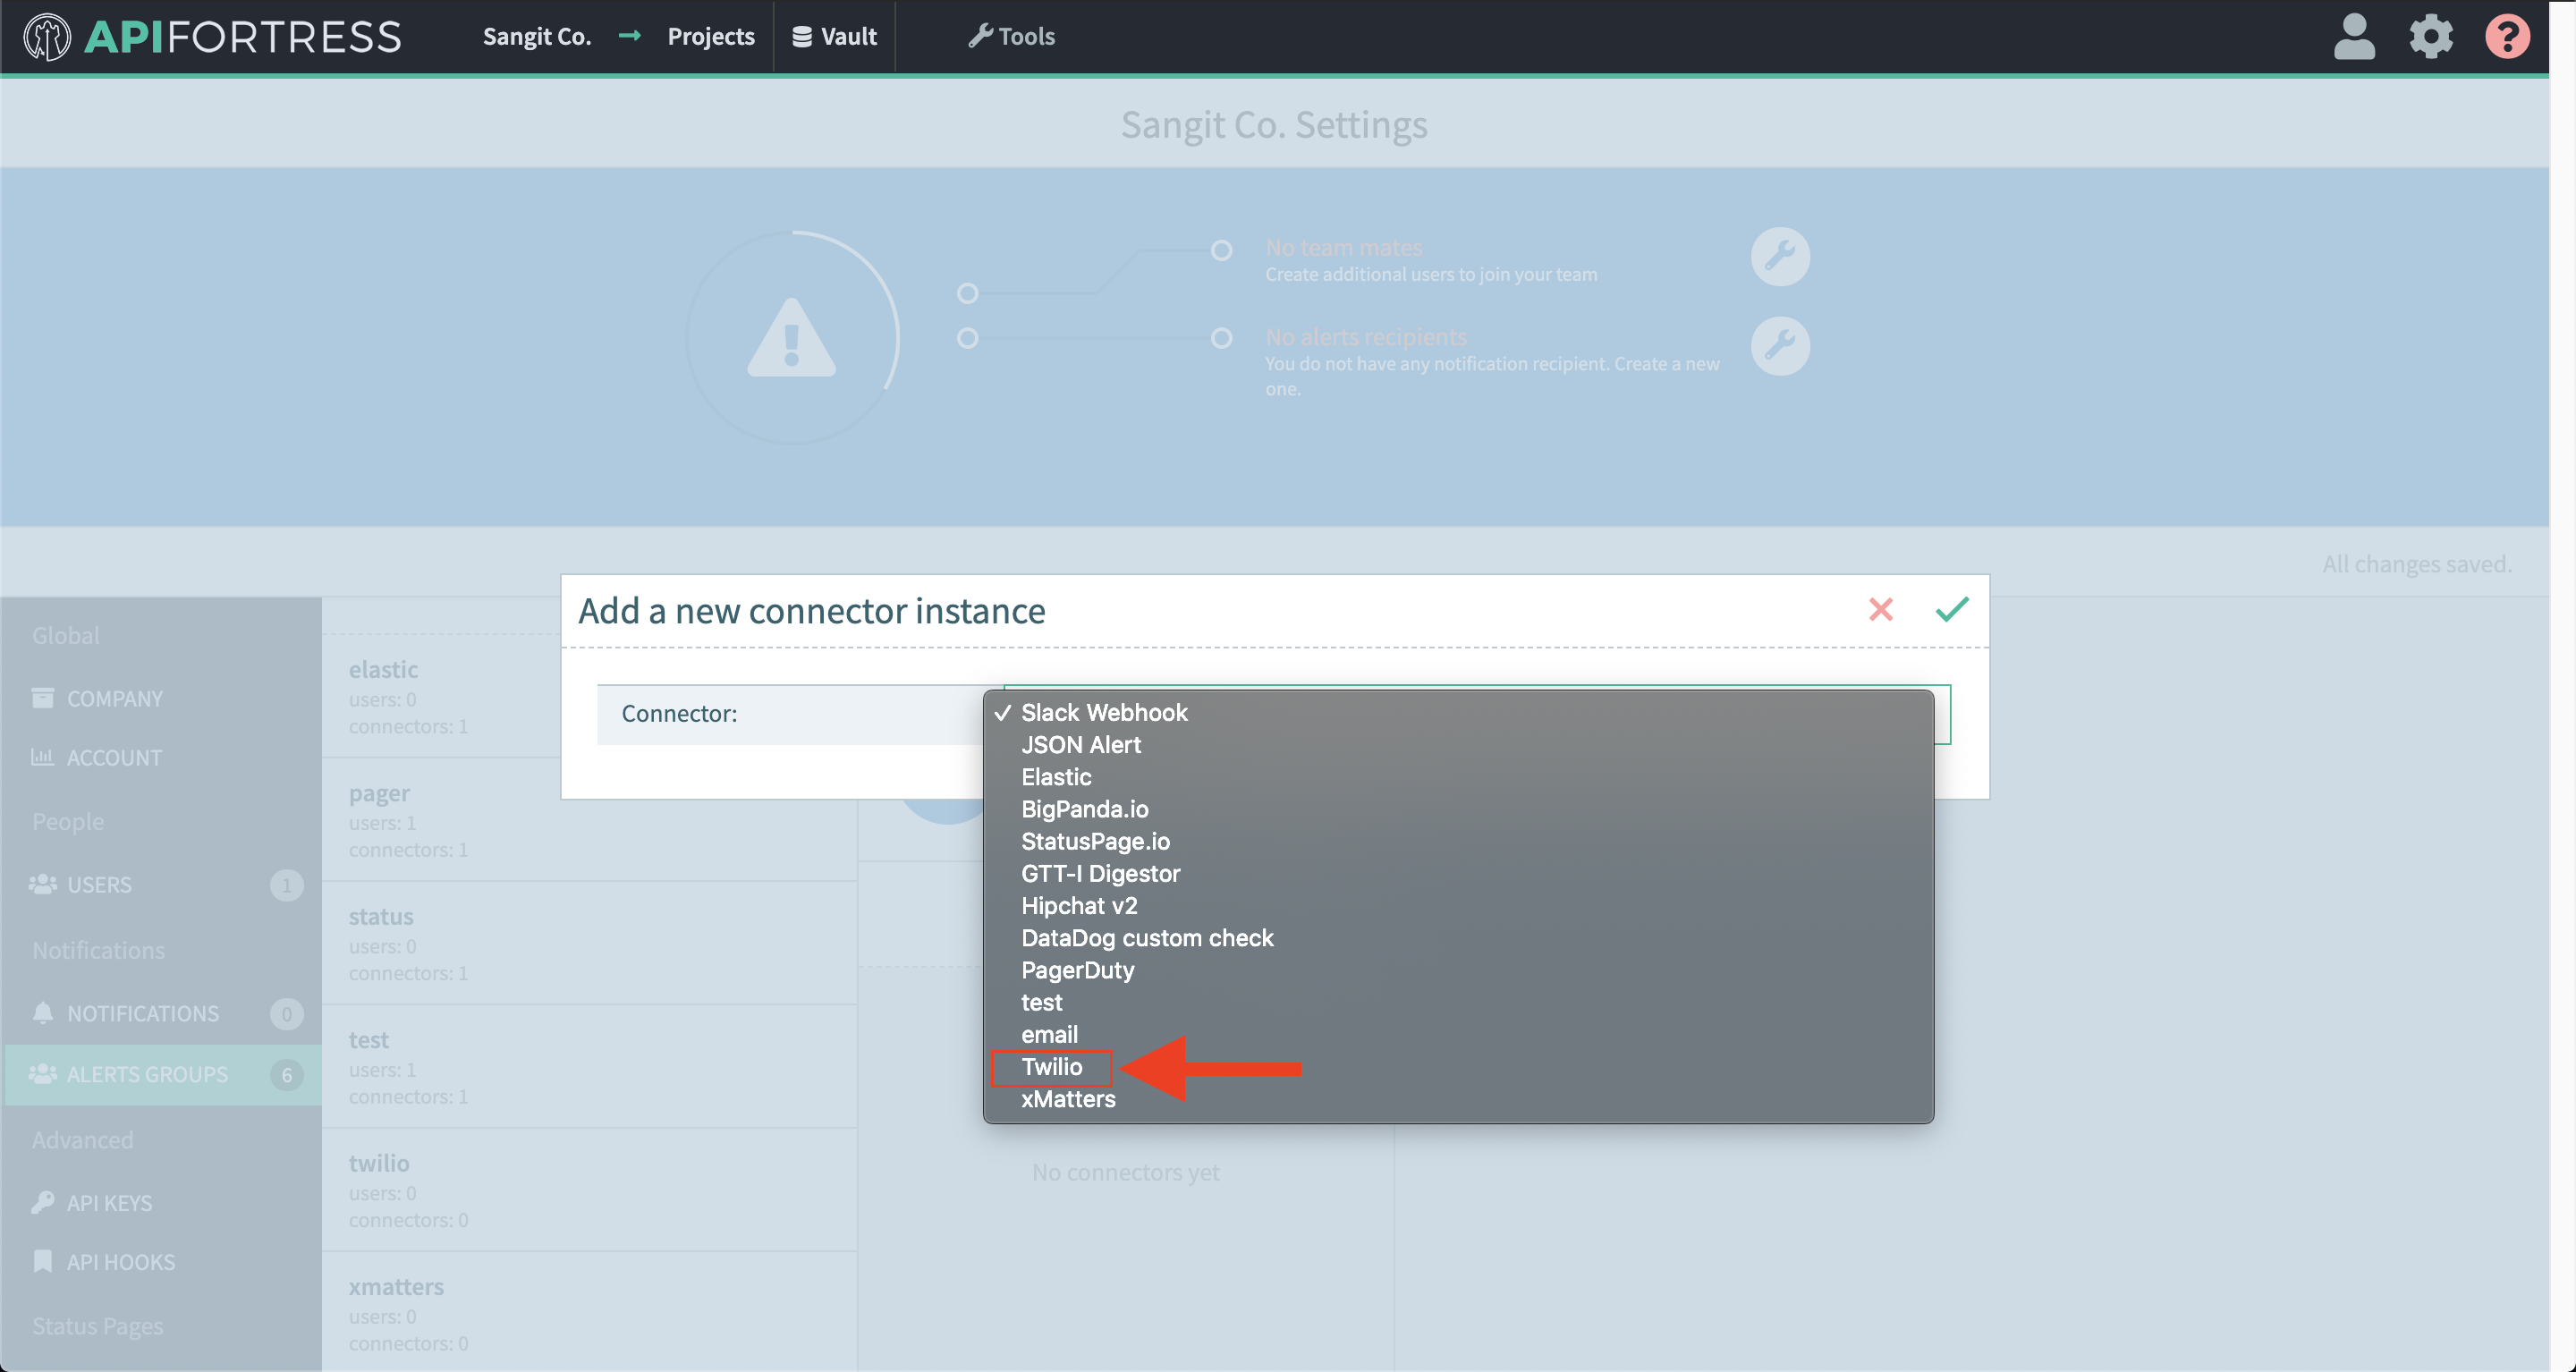
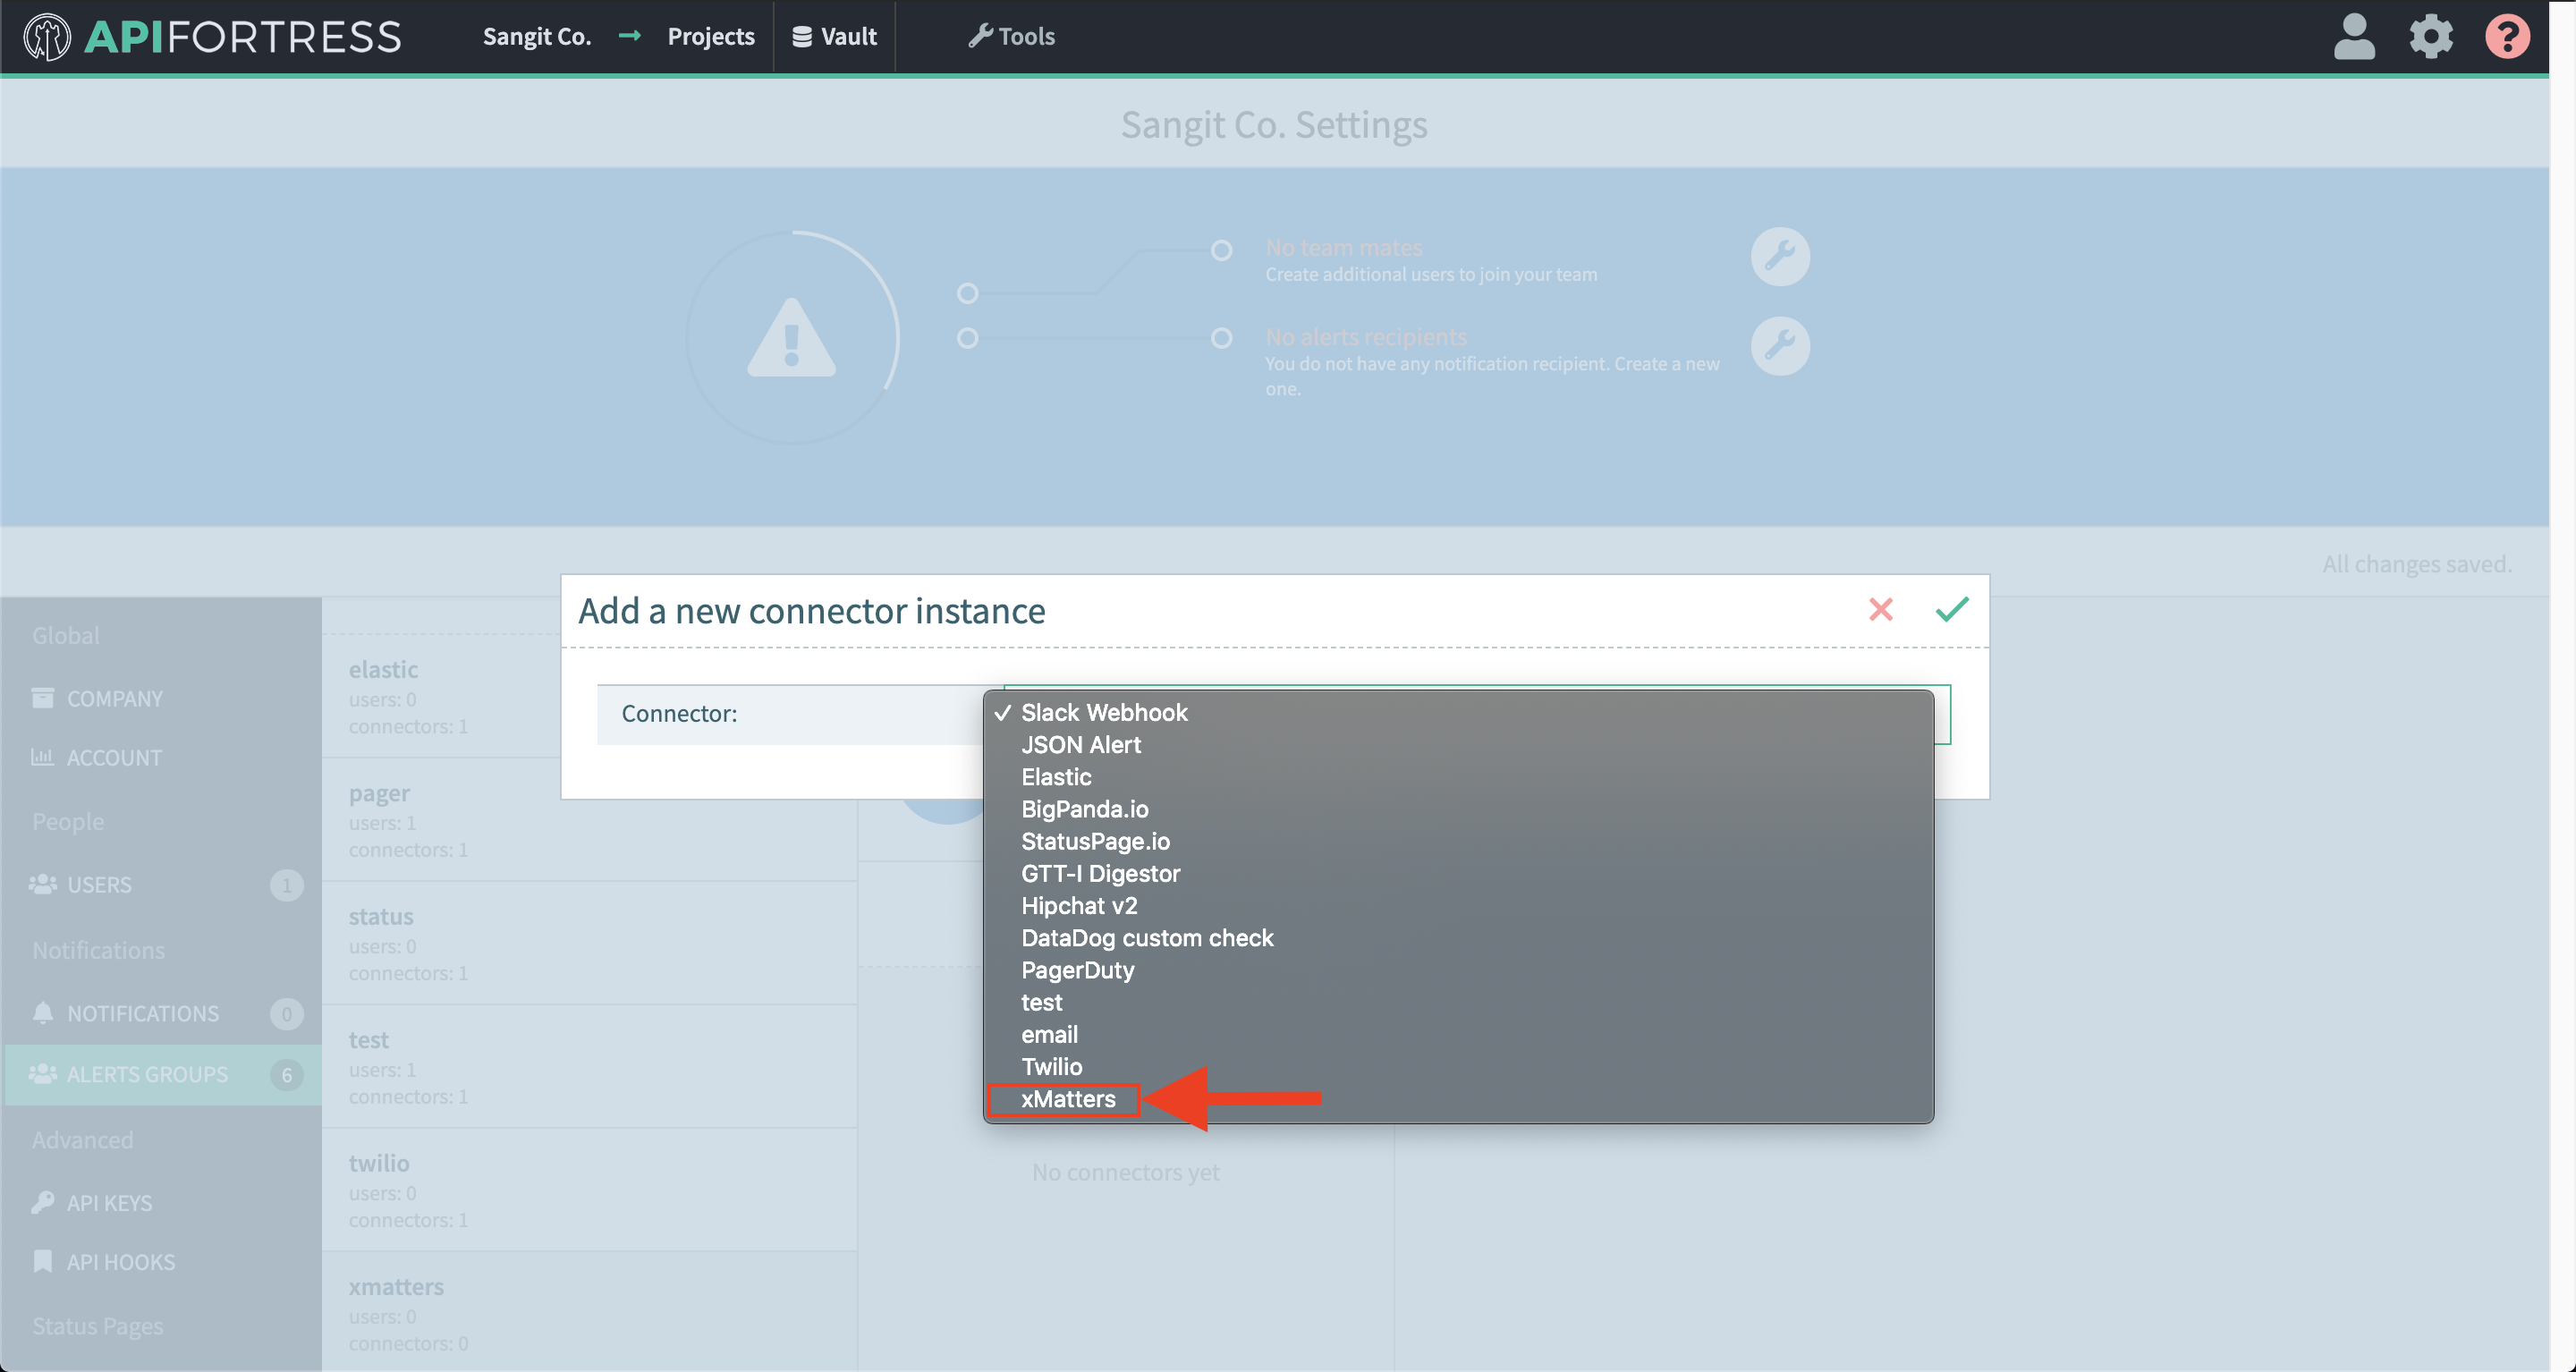
- Select “Elastic” from the list
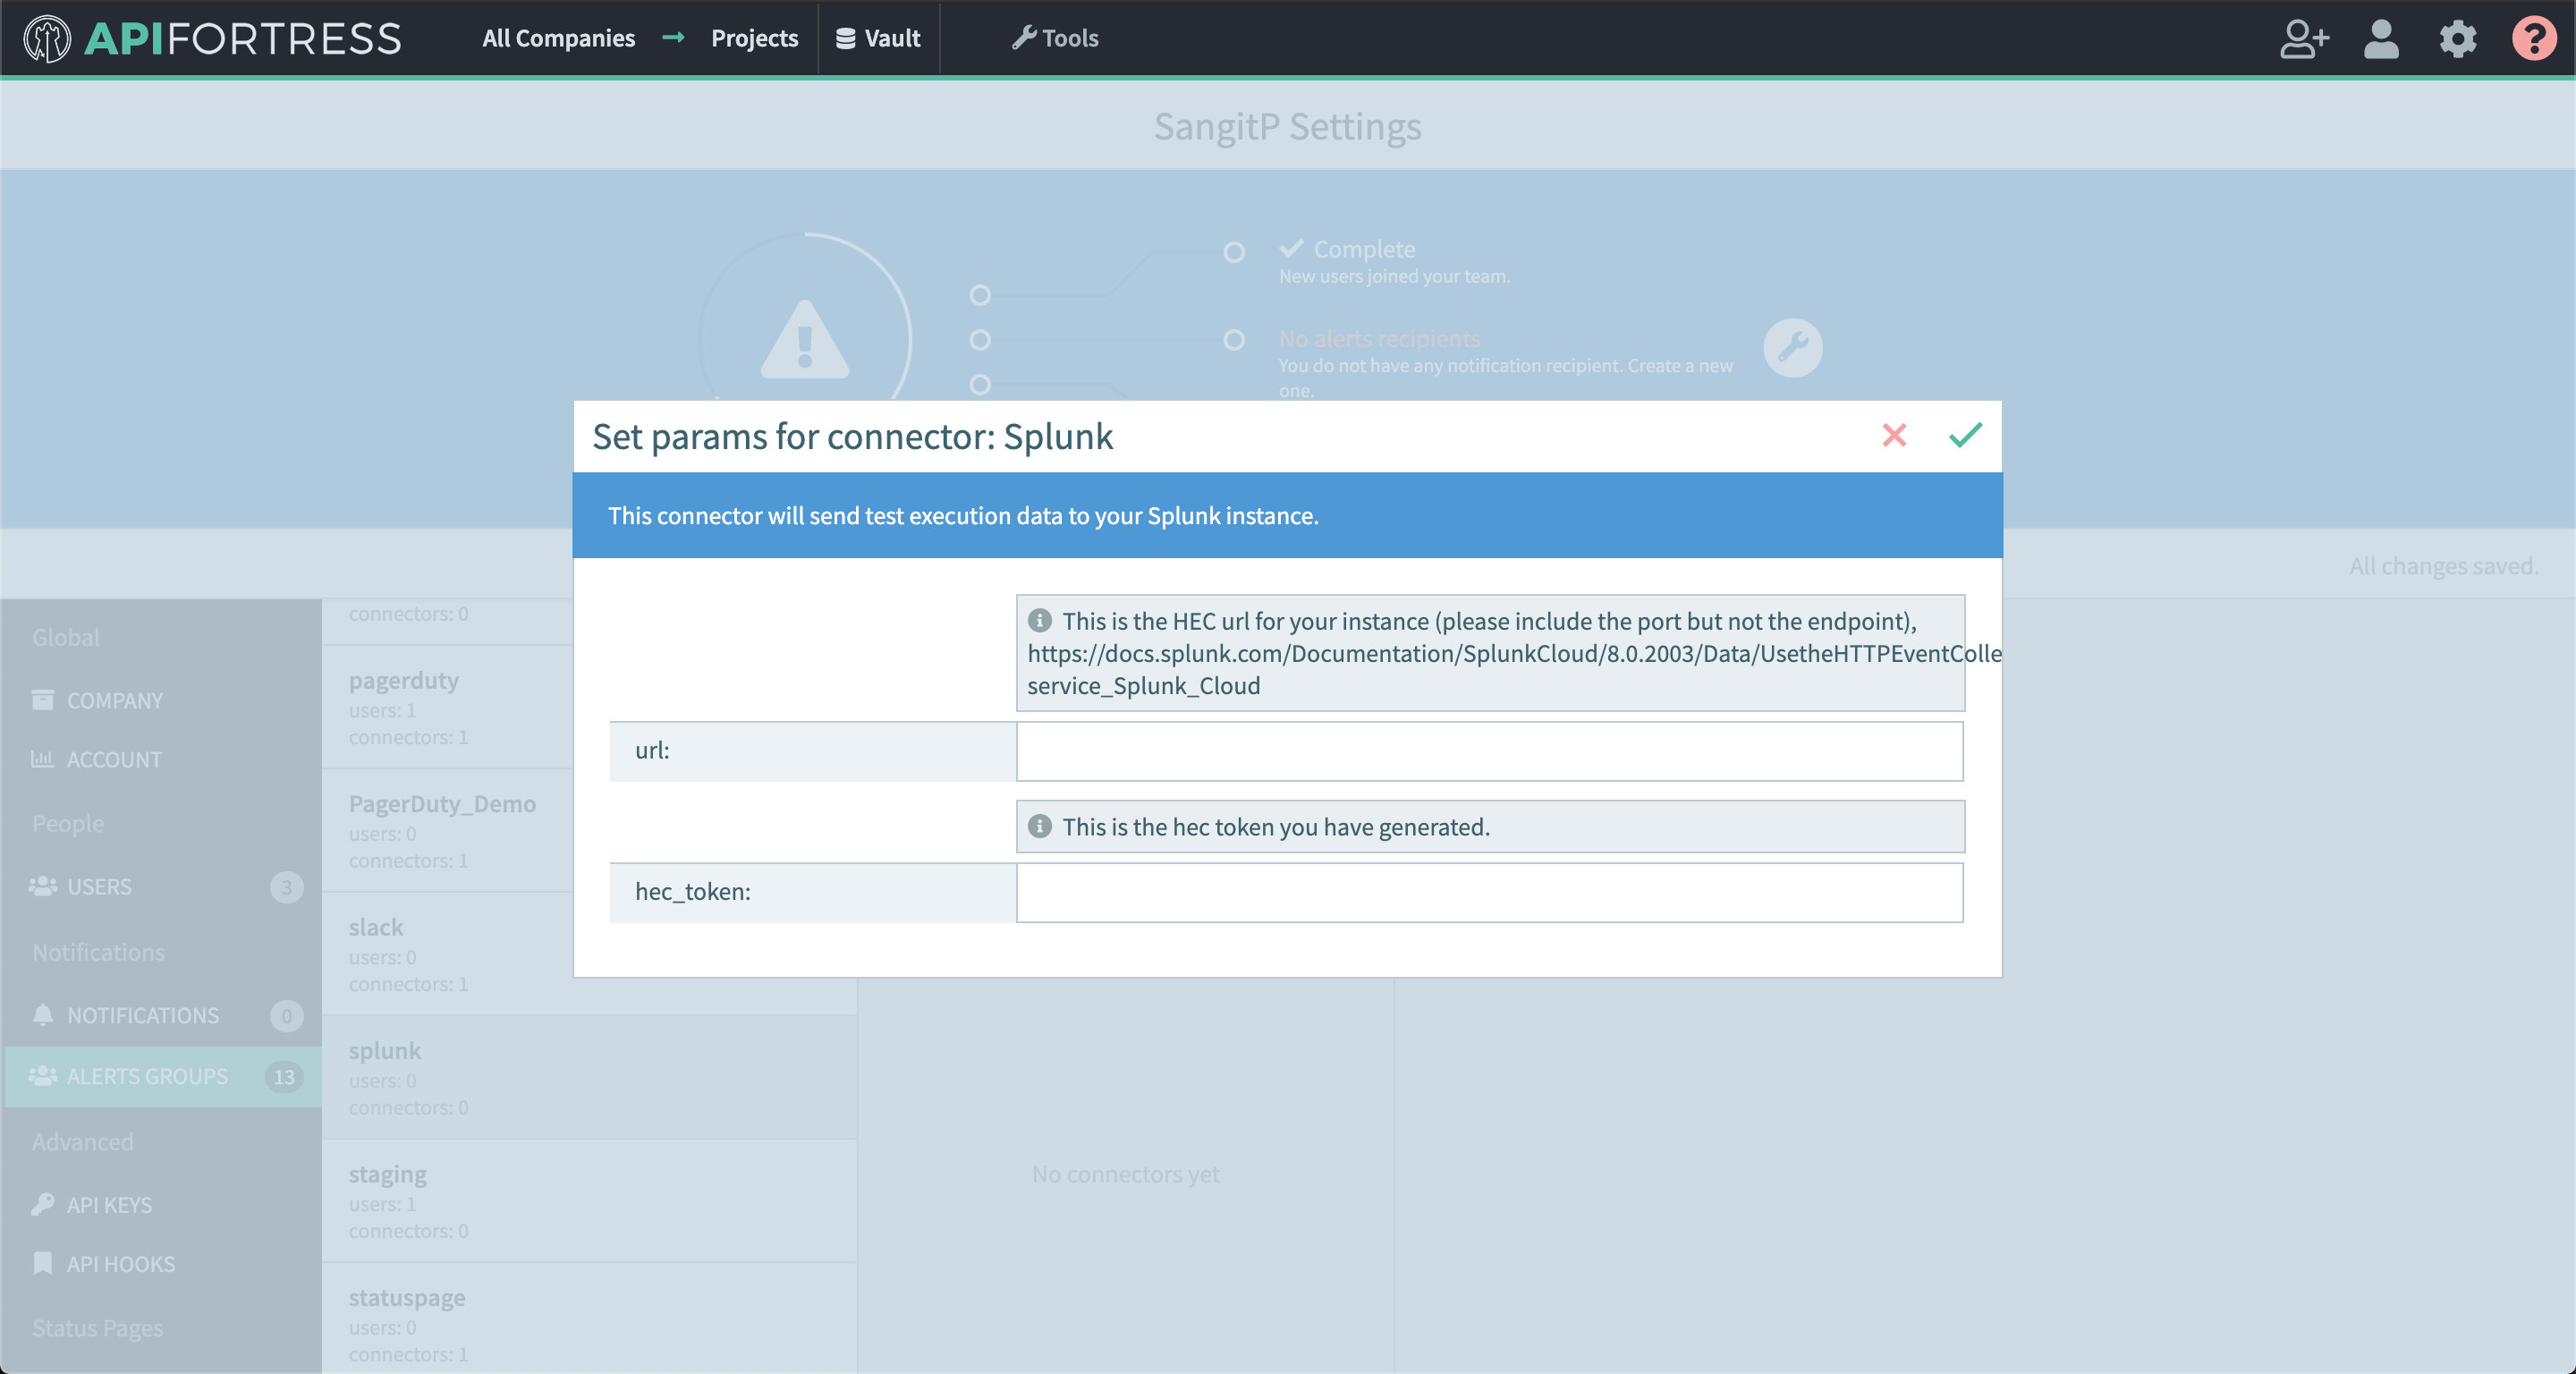
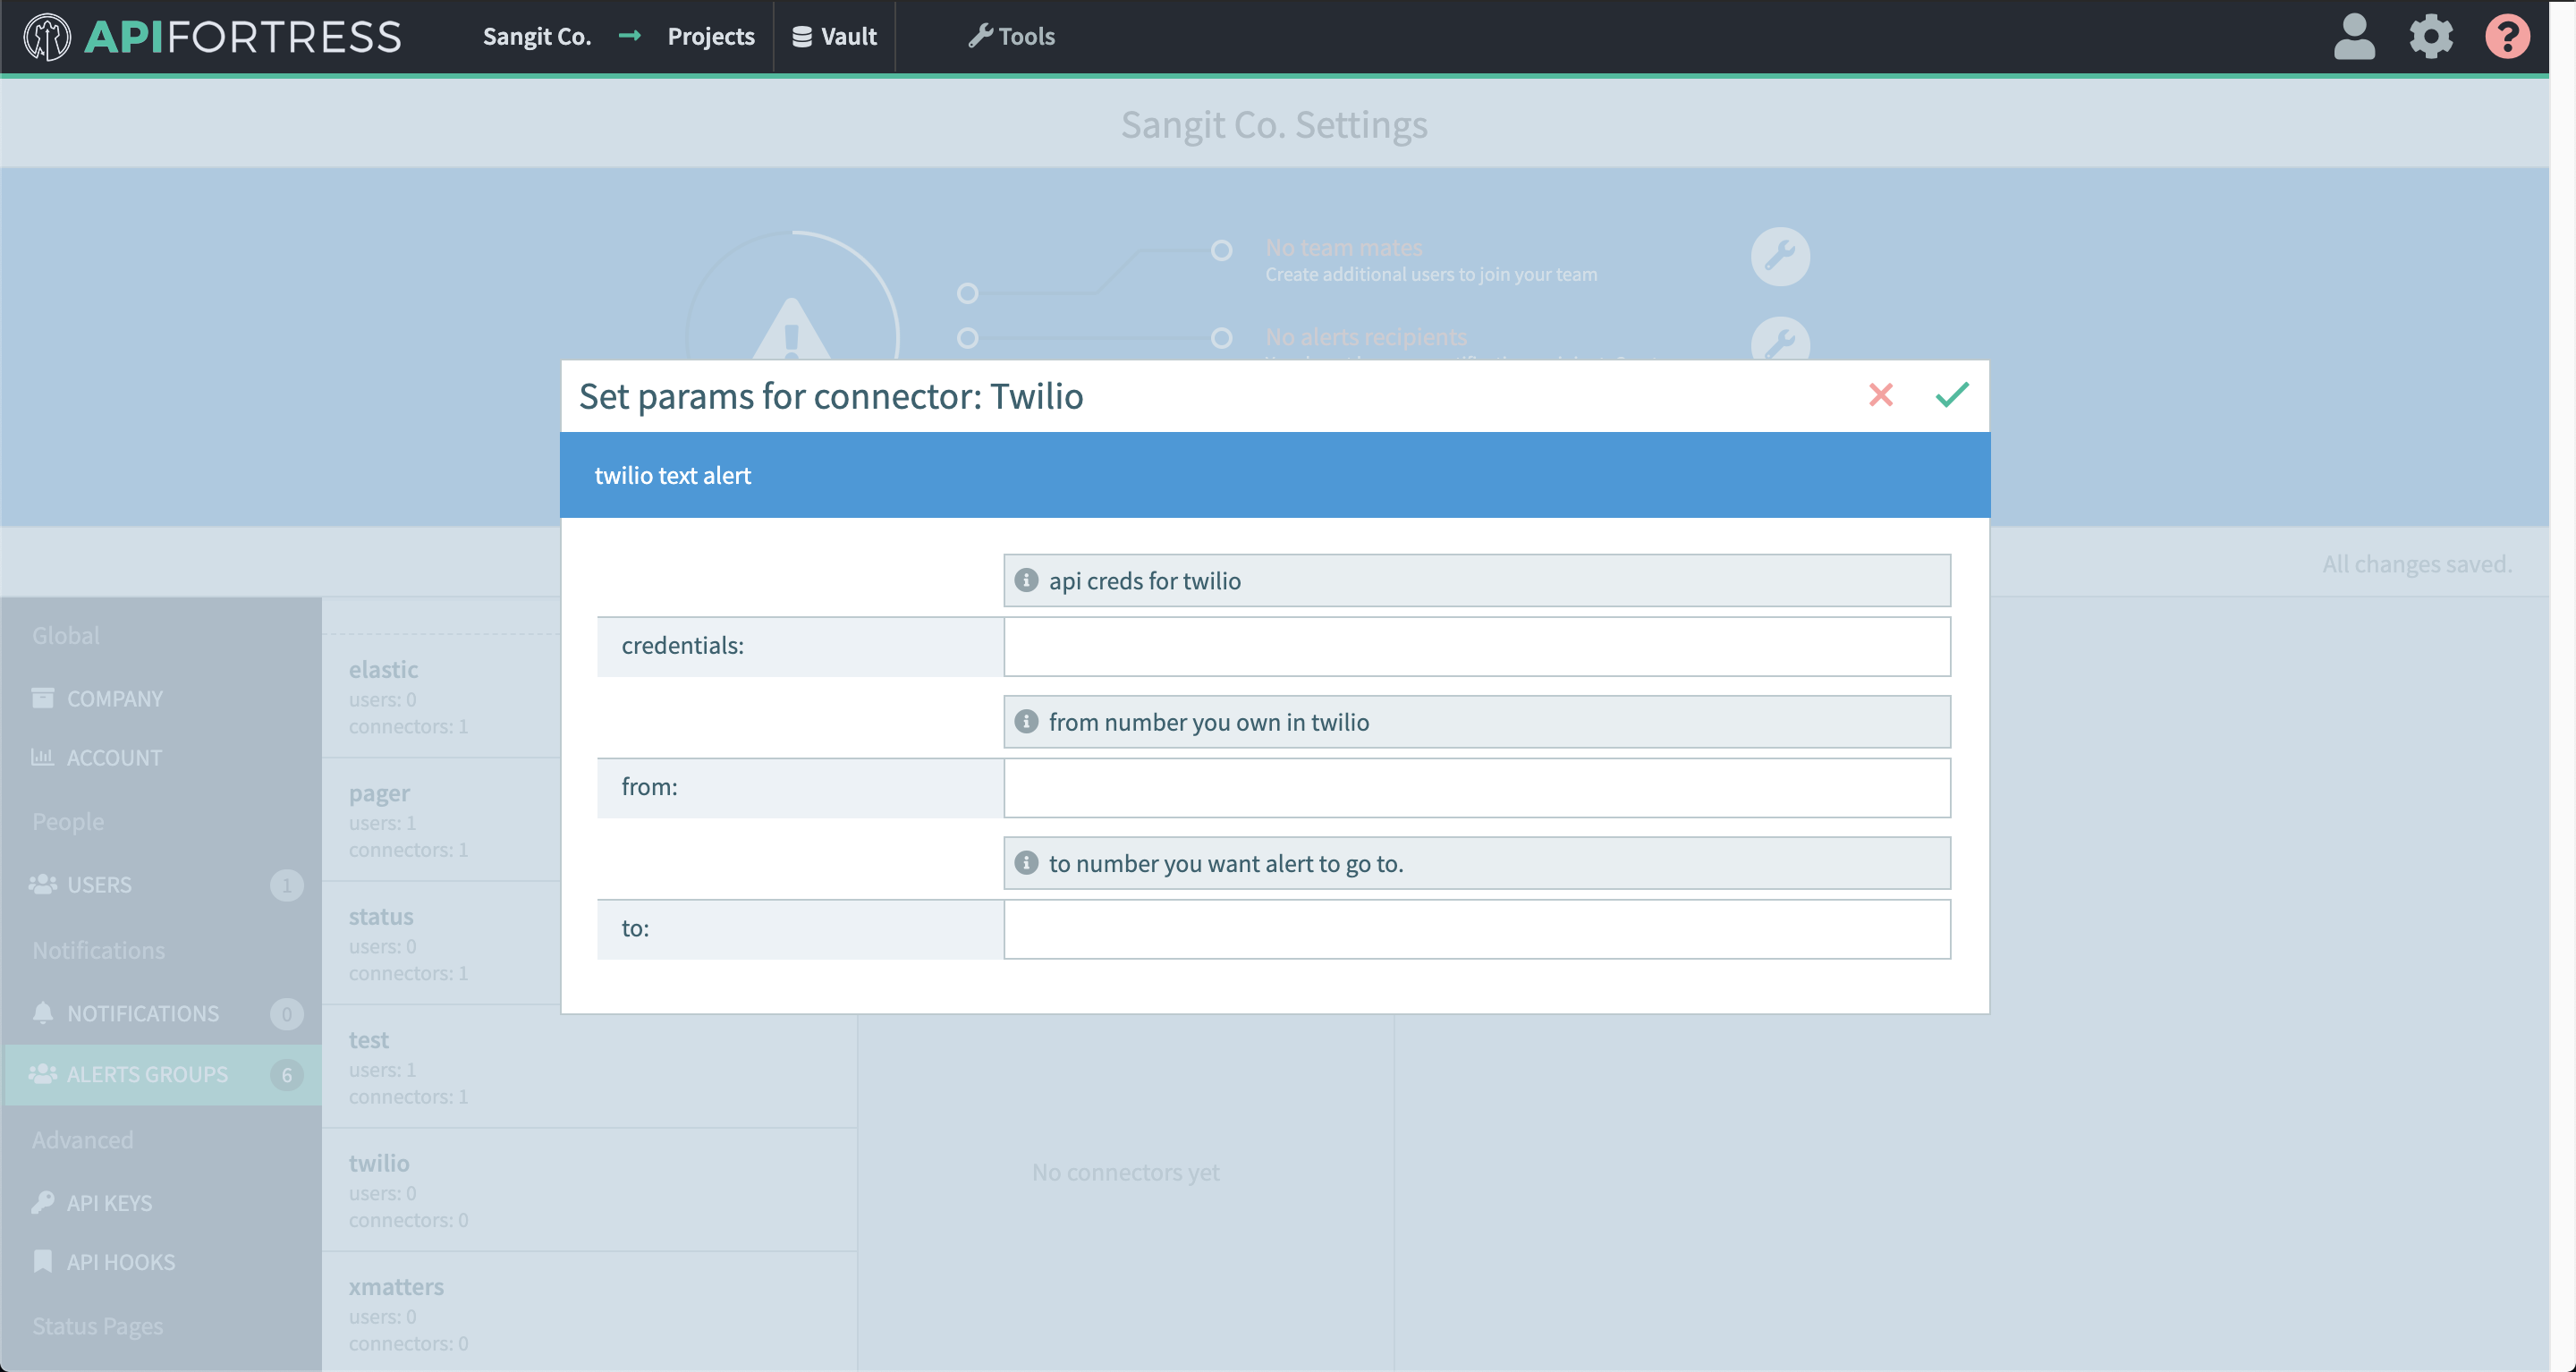
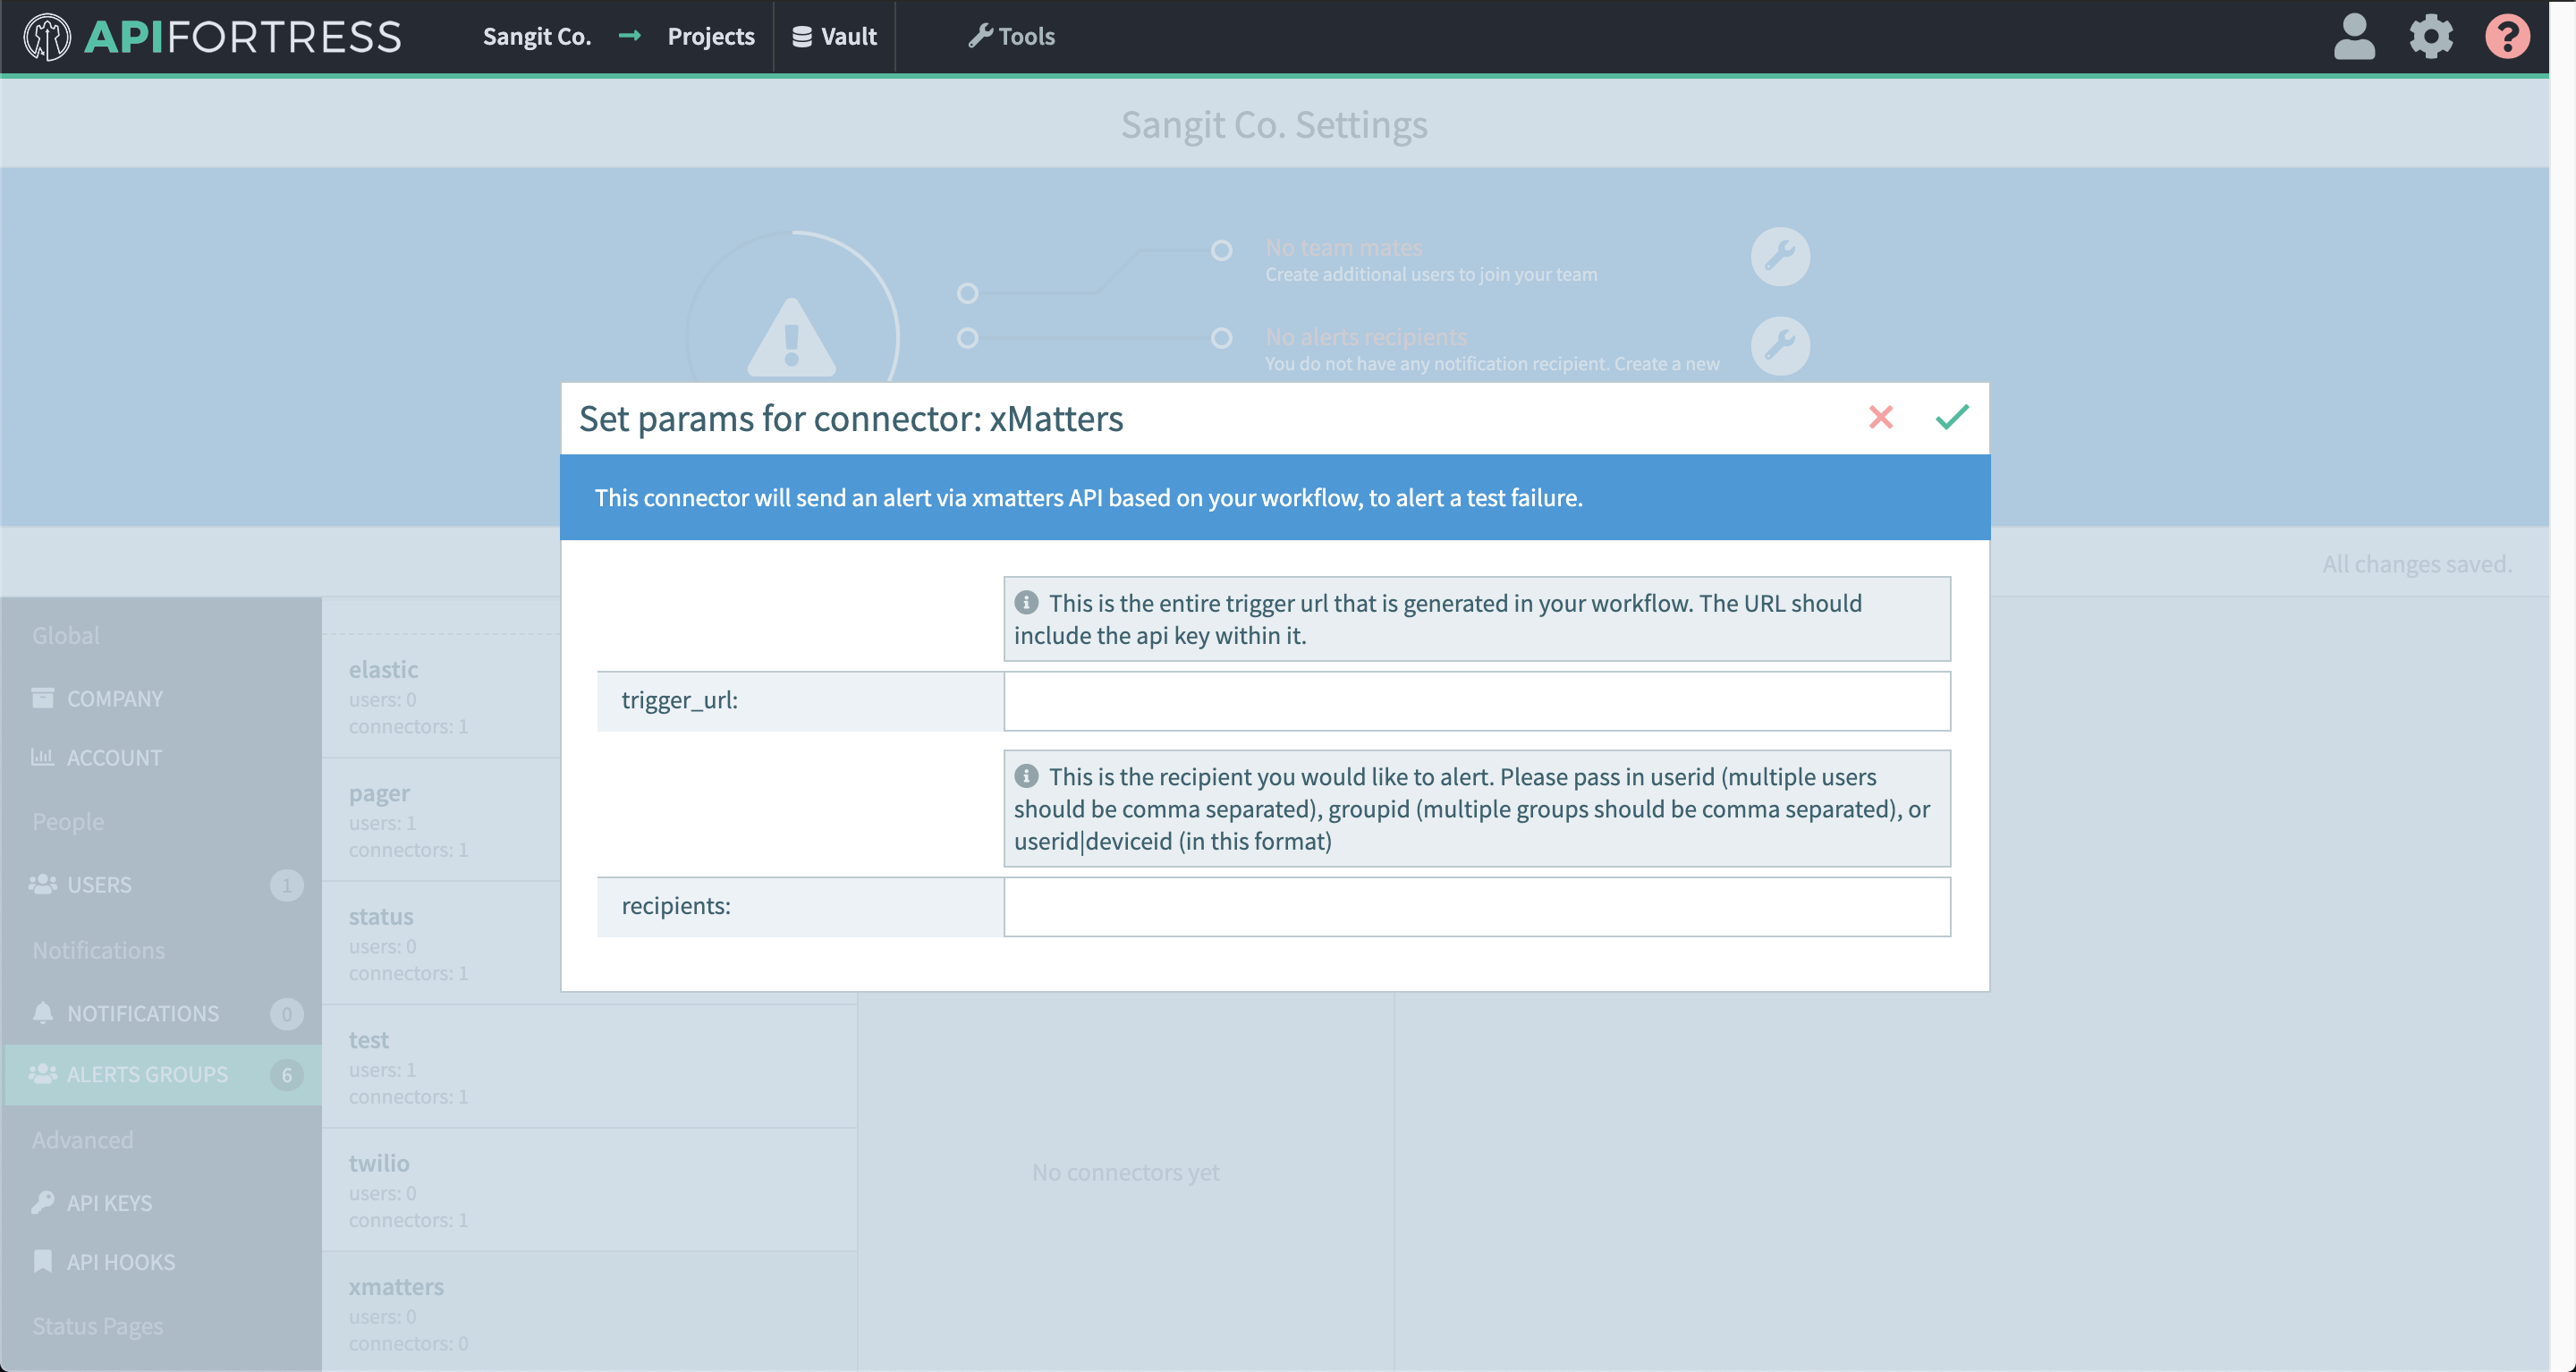
- Enter the required settings
- username: The username for basic authentication
- password: The password for basic authentication.
- baseUrl: The url to the Elasticsearch engine
- Save
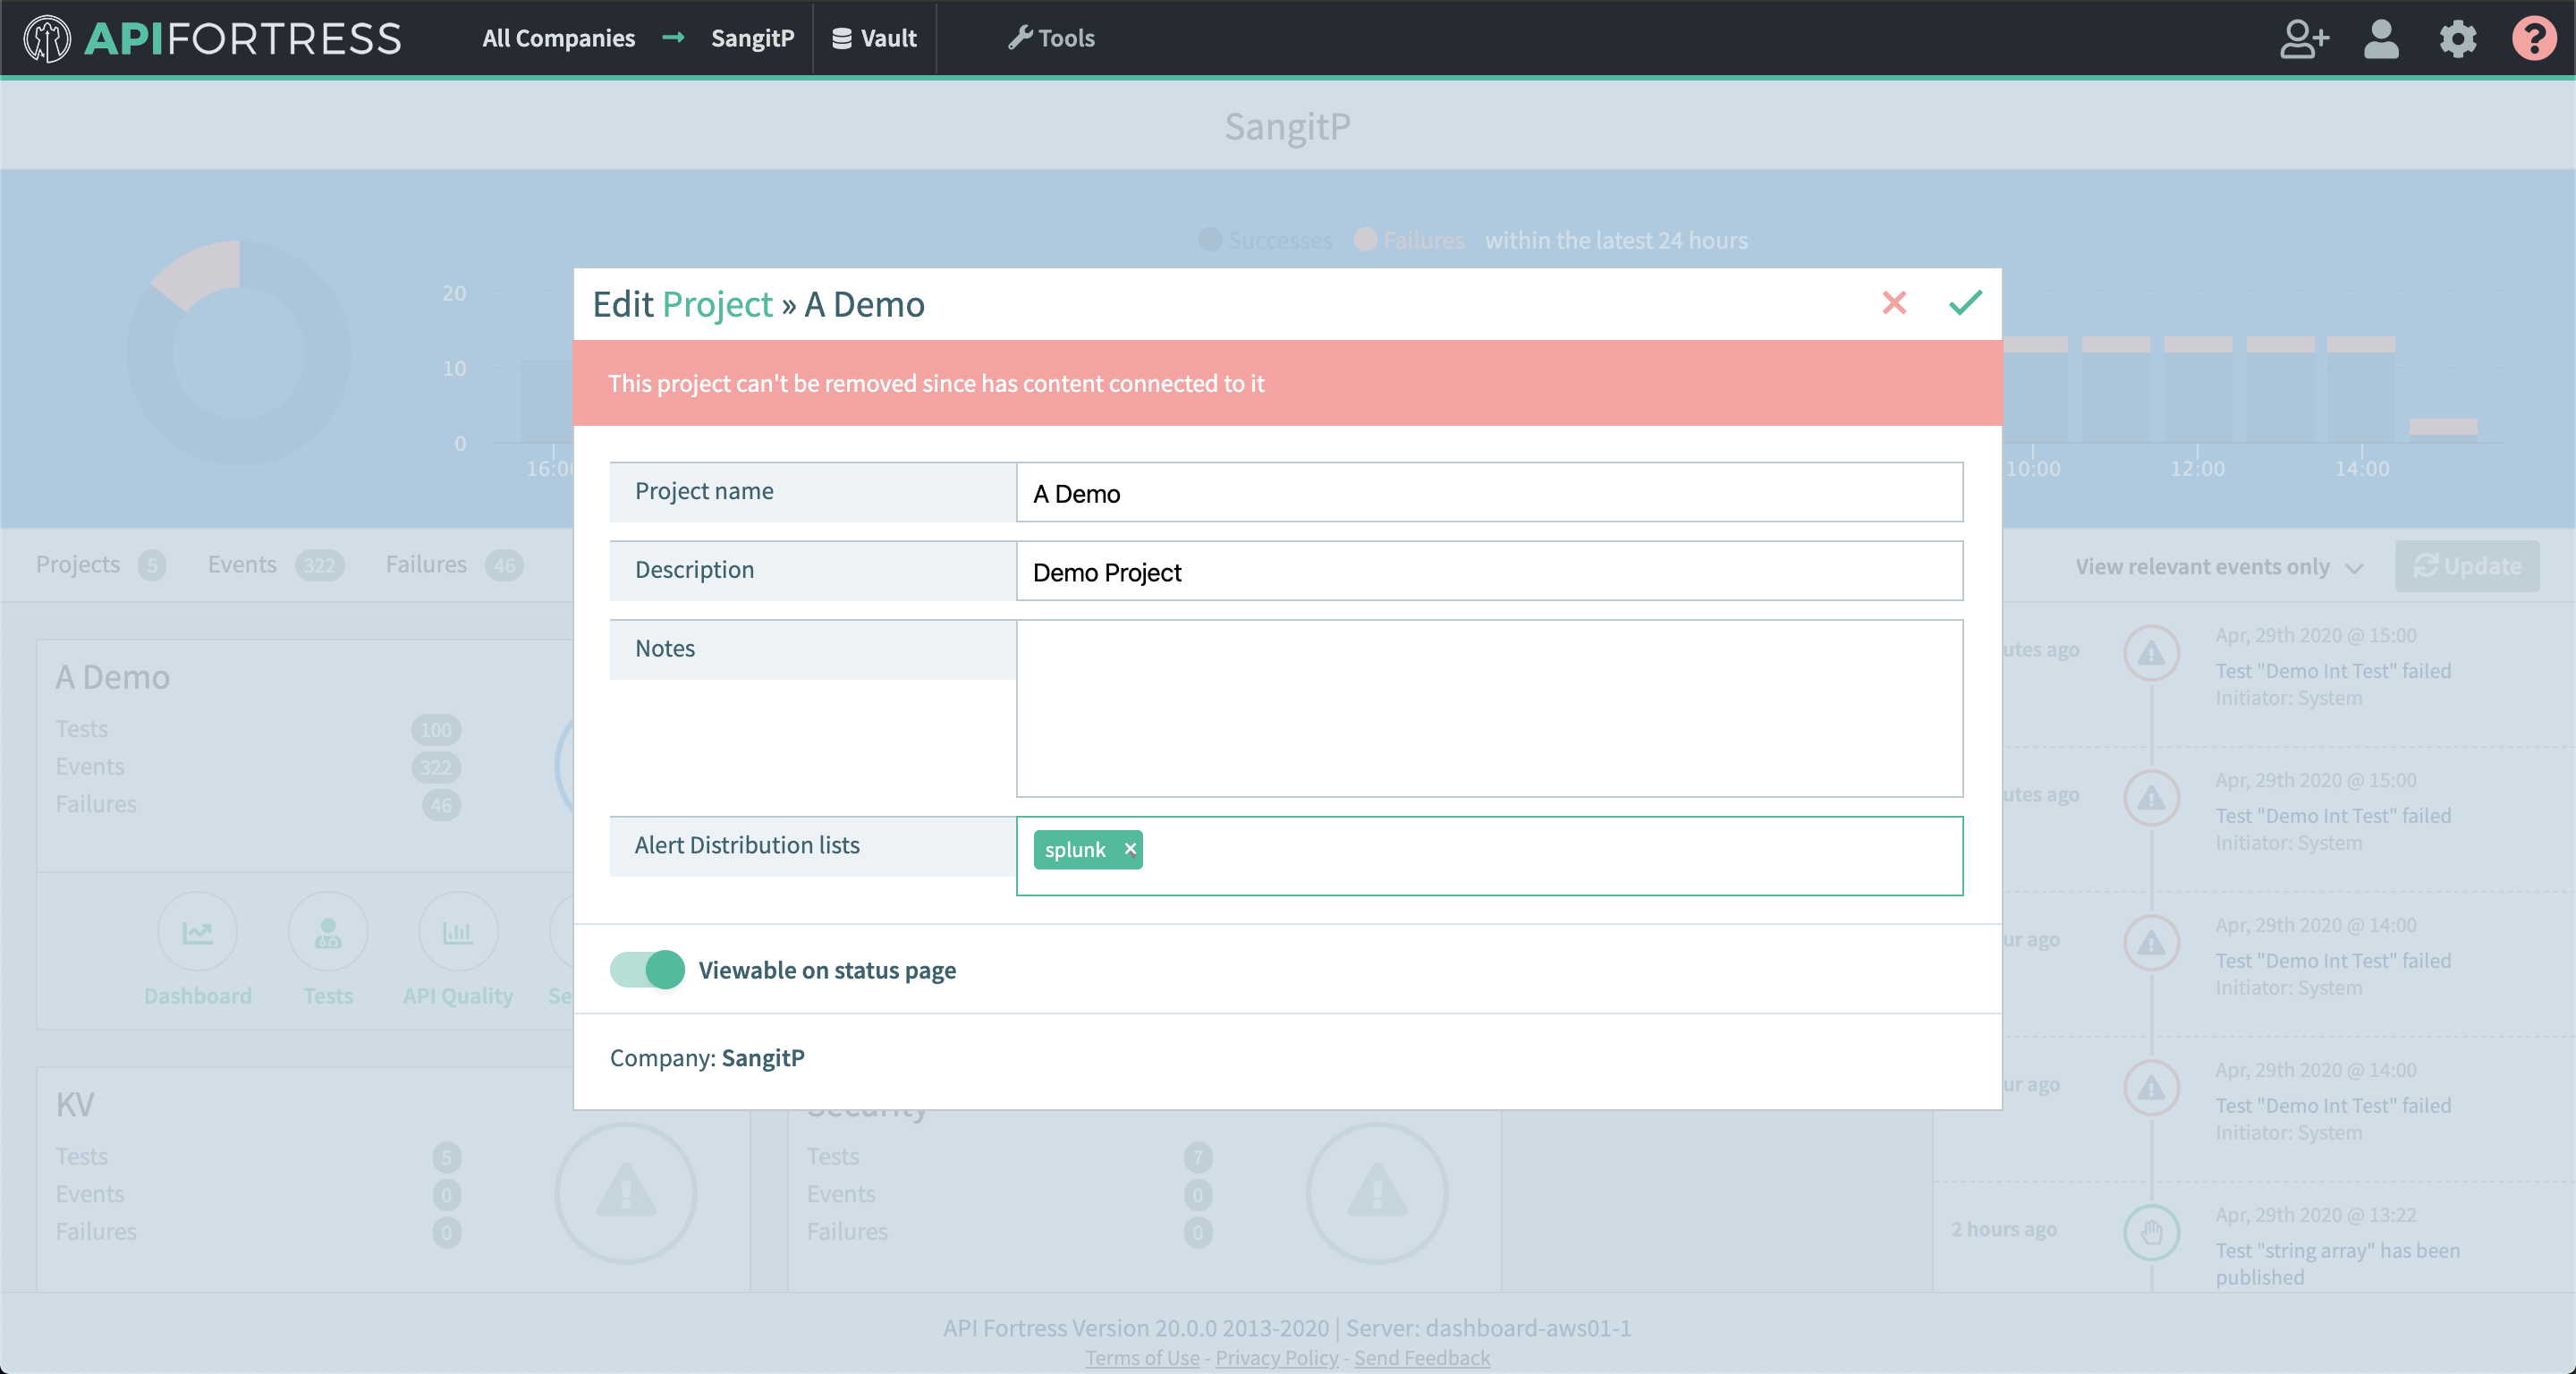
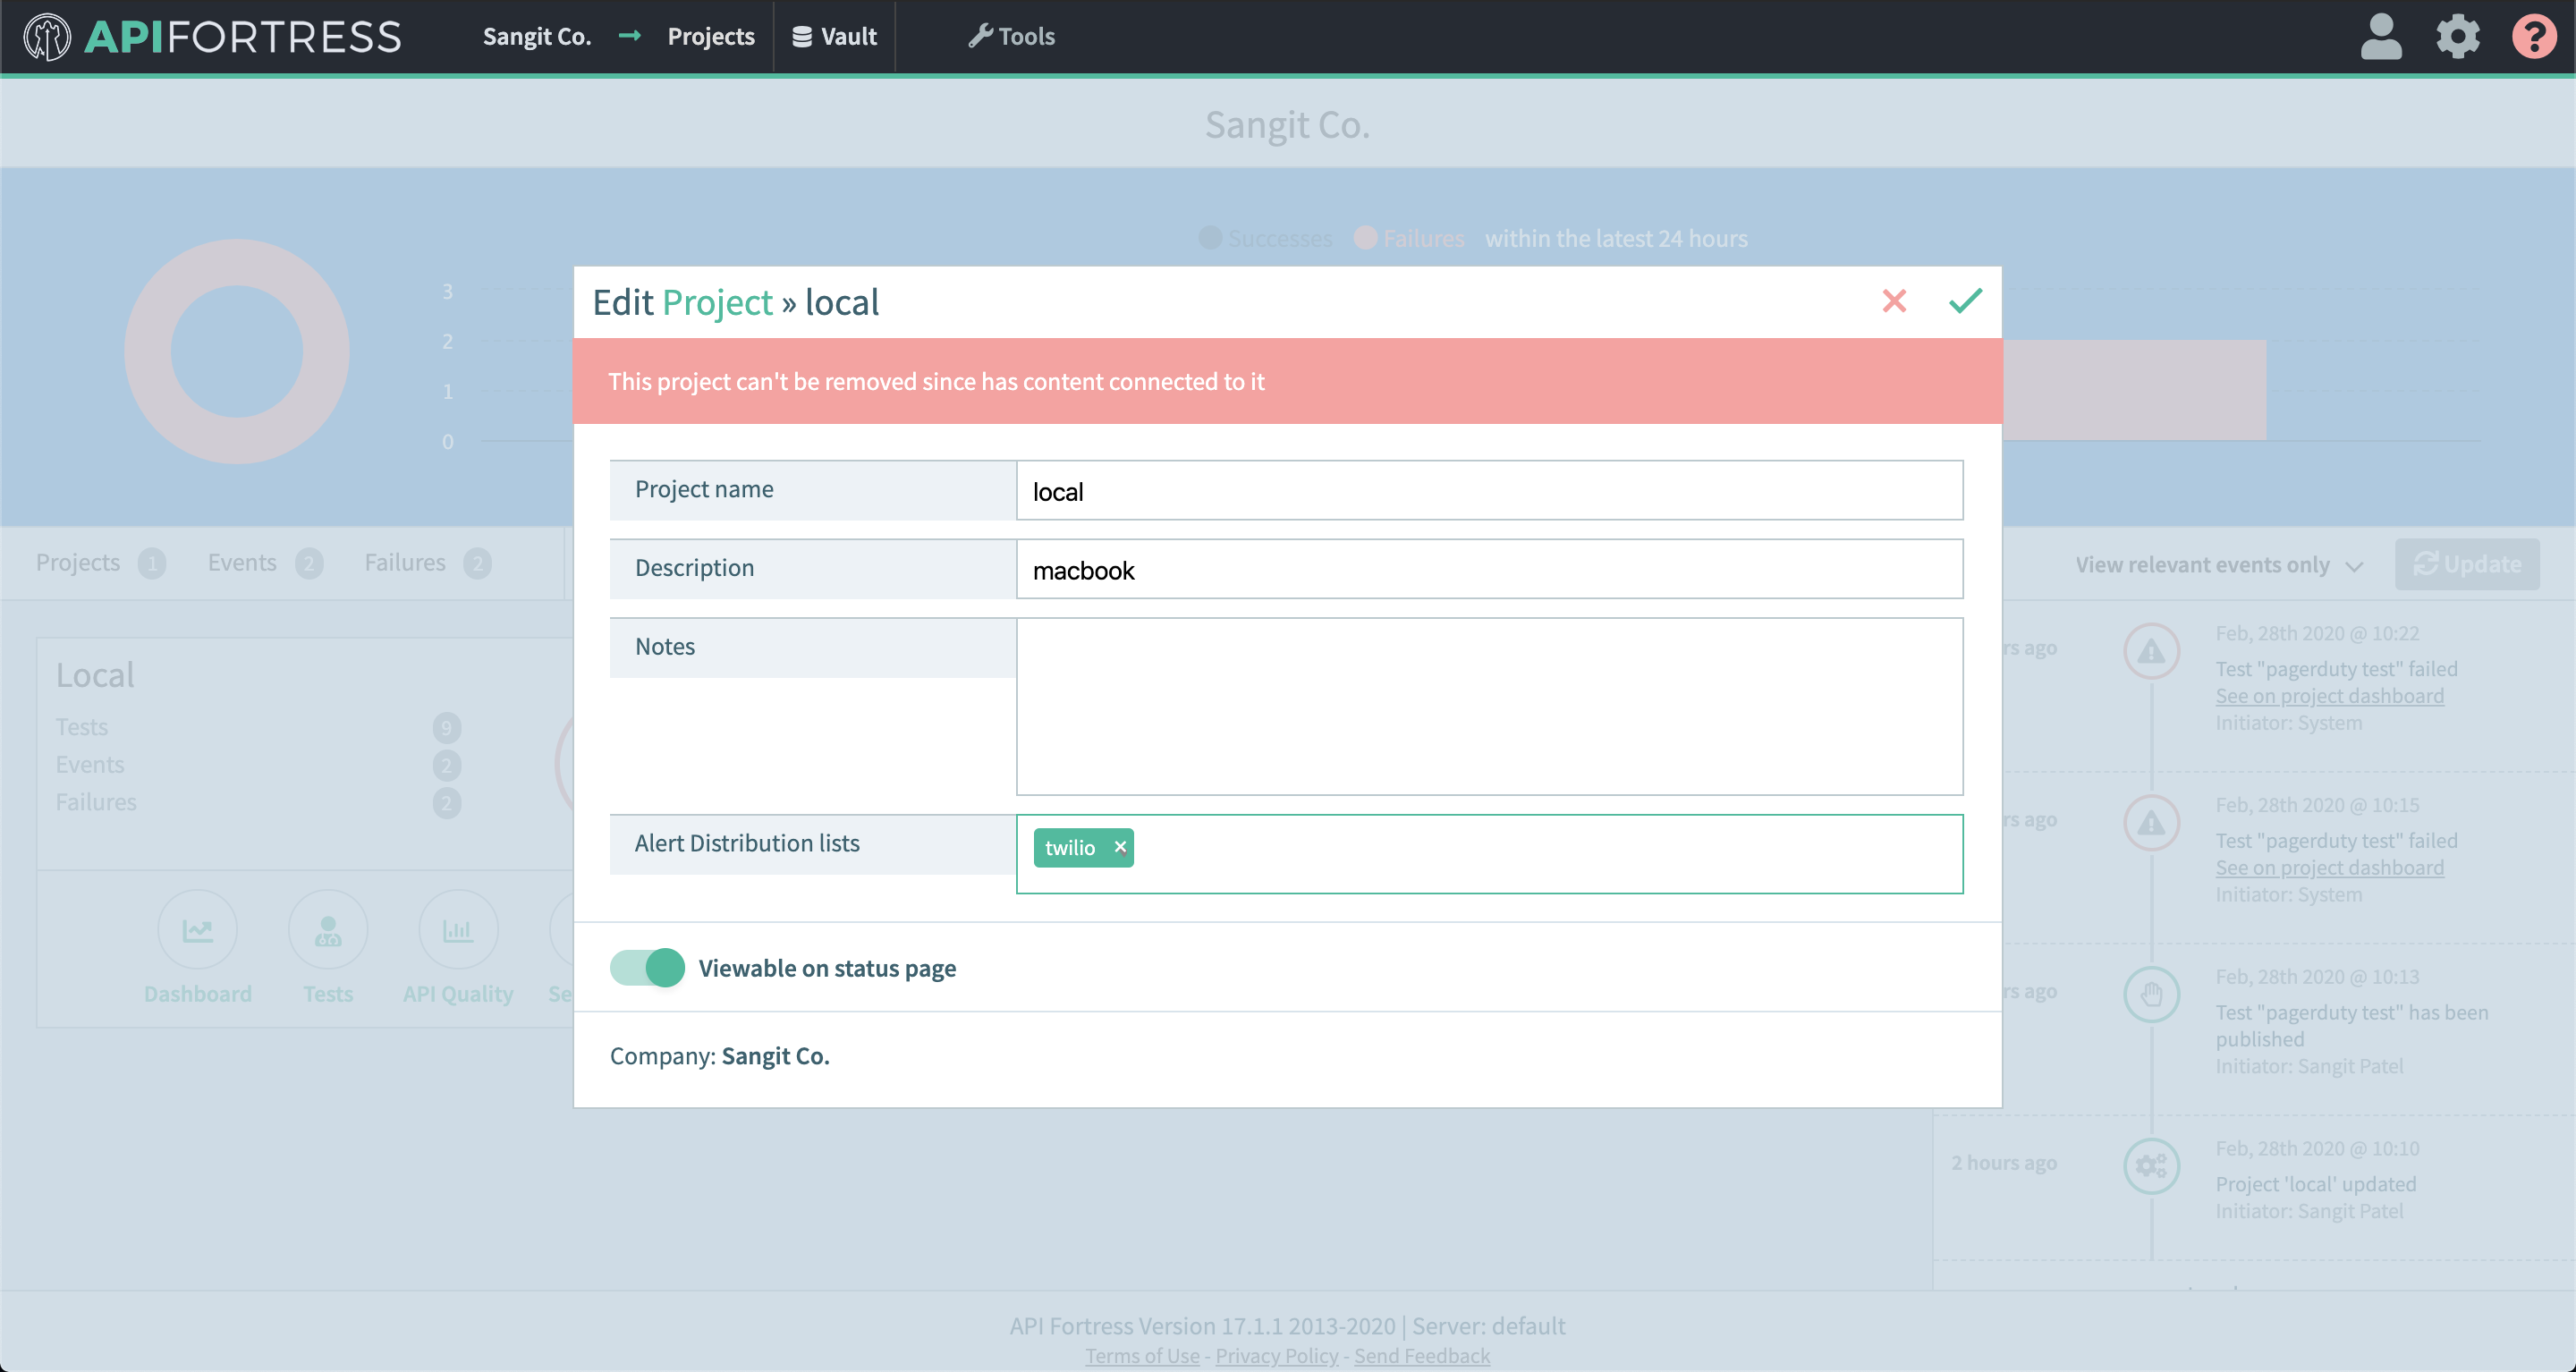
- From the main dashboard, edit the “Settings” the project(s) you want to assign the alert group to if the group has not been assigned yet

Example Use Case
Sample Data:
Below is a sample of the data that will be pushed into Elasticsearch:
{
    "date": "2017-12-29T14:36:31+0000",
    "eventId": "5a4aa0a1-d071-4a05-981d-ff57e4ff3897",
    "test": {
        "name": "book",
        "id": "123a"
    },
    "value2": "fake project",
    "value1": "book",
    "companyName": "fake company",
    "eventType": "failure",
    "criticalFailures": [{
        "action": "get",
        "expression": "get http://www.example.com",
        "status": "Generic Failure",
        "failureType": "MissingPropertyException",
        "extra": "Error parsing URL. Missing variable yay"
    }],
    "companyId": 1,
    "failuresCount": 1,
    "location": "Ashburn,Virginia",
    "projectName": "fake project",
    "projectId": 1
}
Sample Visualization:
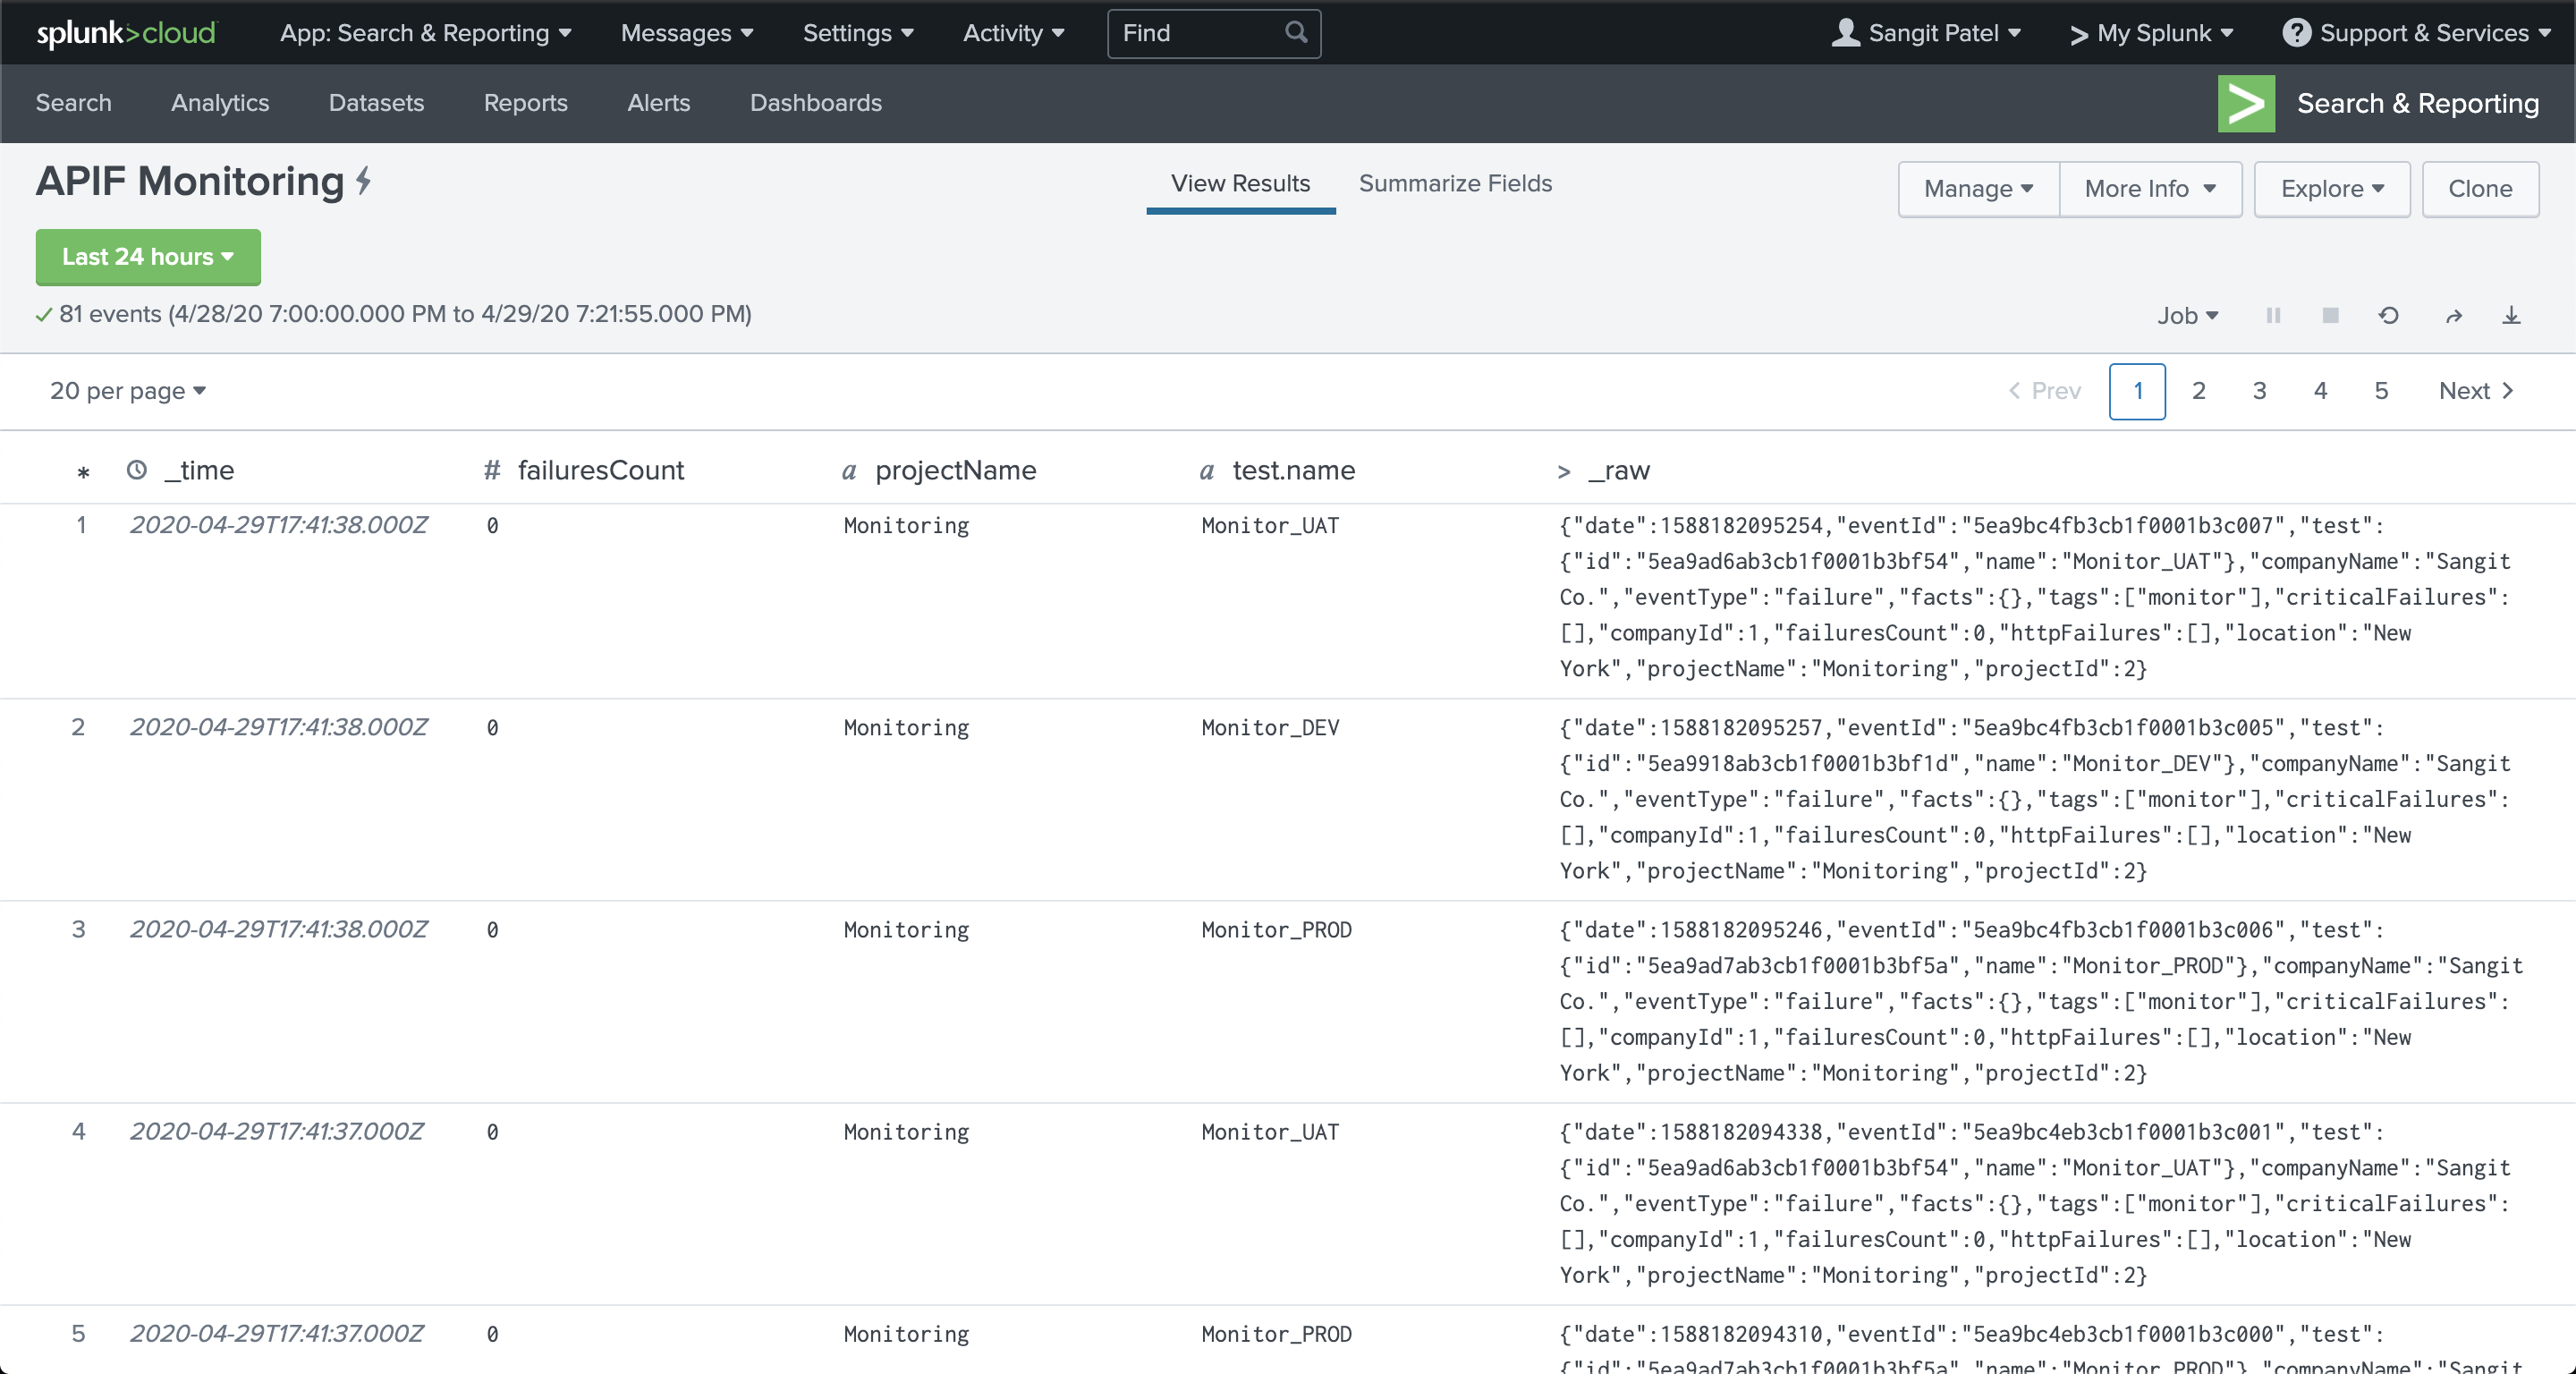
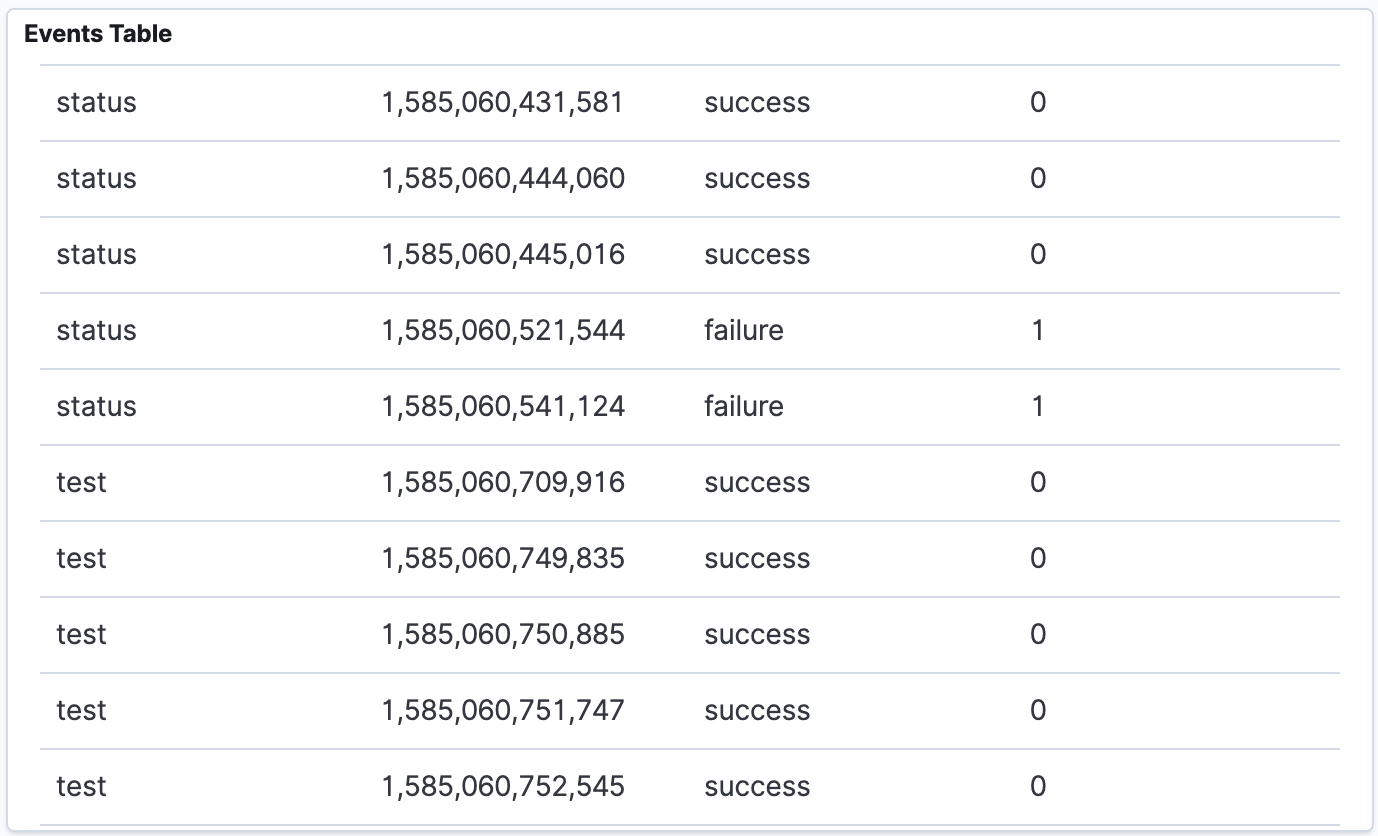
Once the data is in Elasticsearch, you can pull that data into Kibana and create visualizations for it. You can create many things using the data in the JSON above.
For example you could create a table to show all the test executions and their success or failure like so:
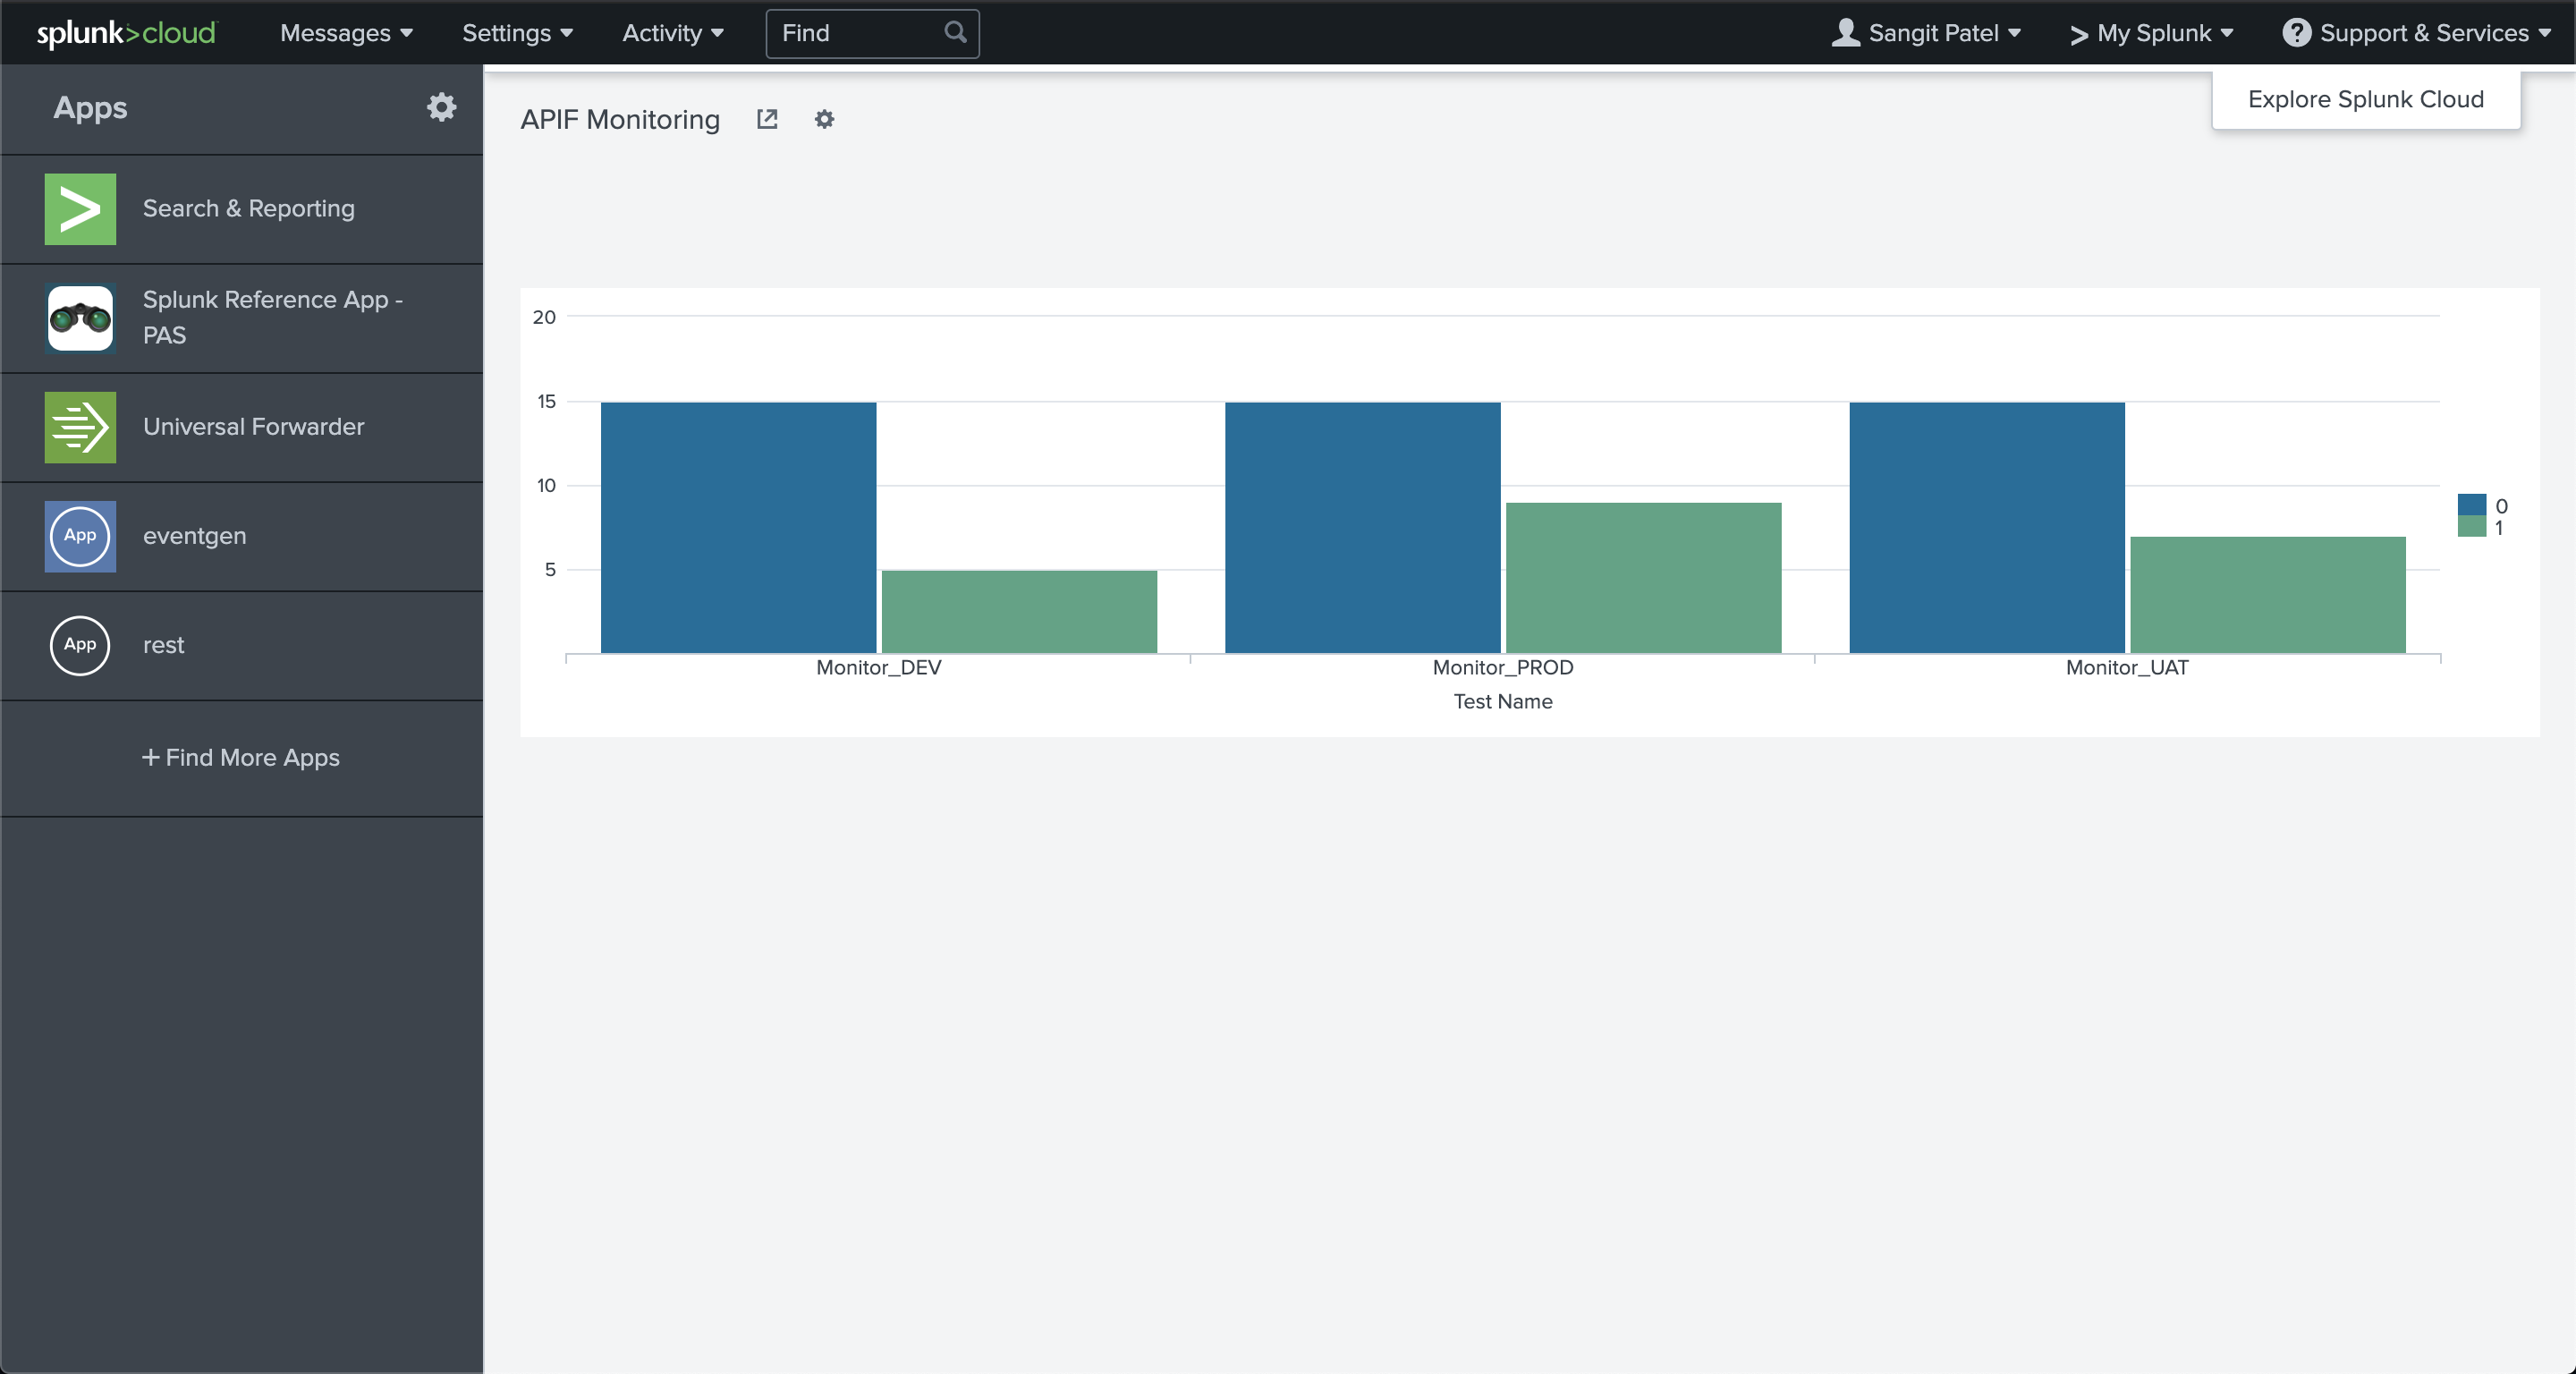
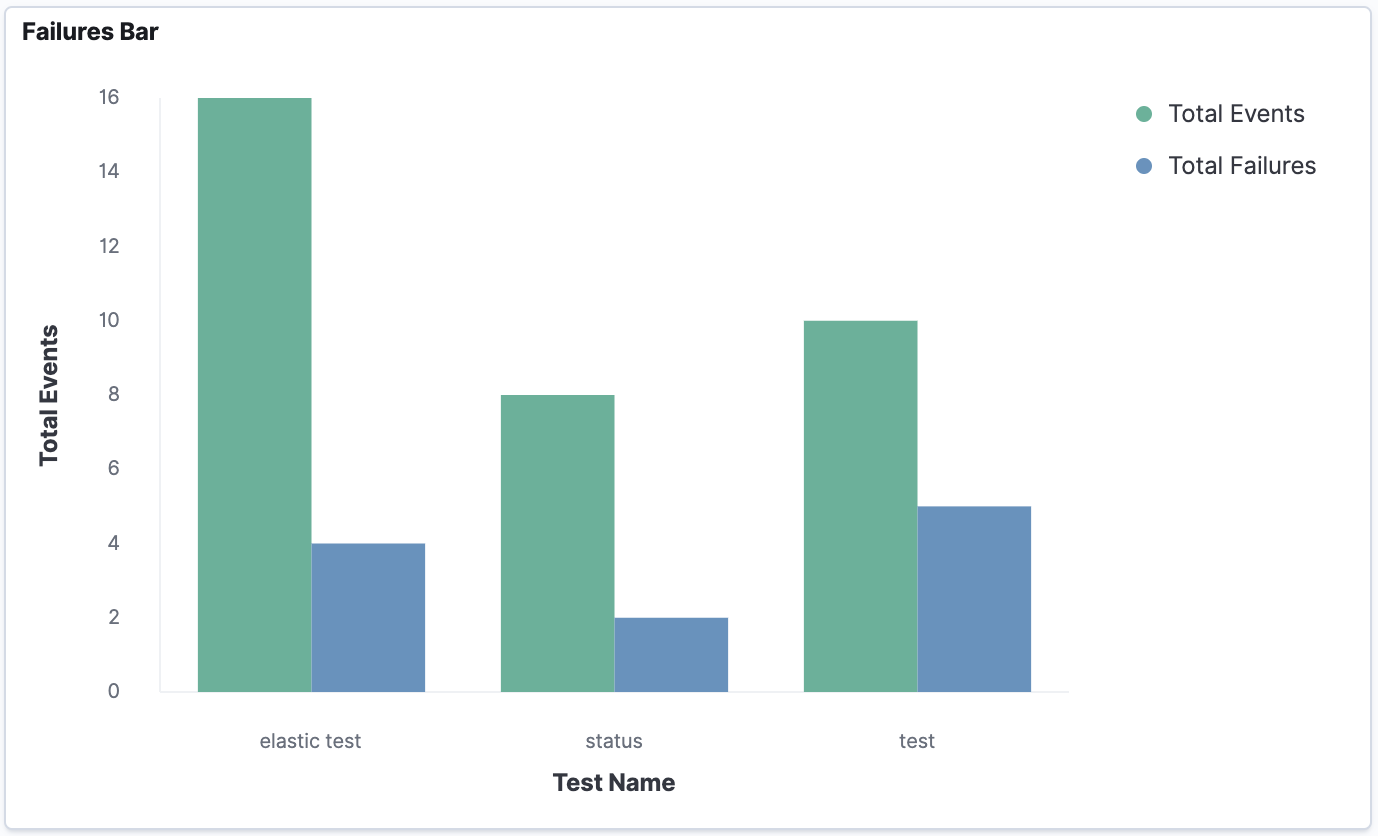
You can also chart the events and failures on a graph like this:
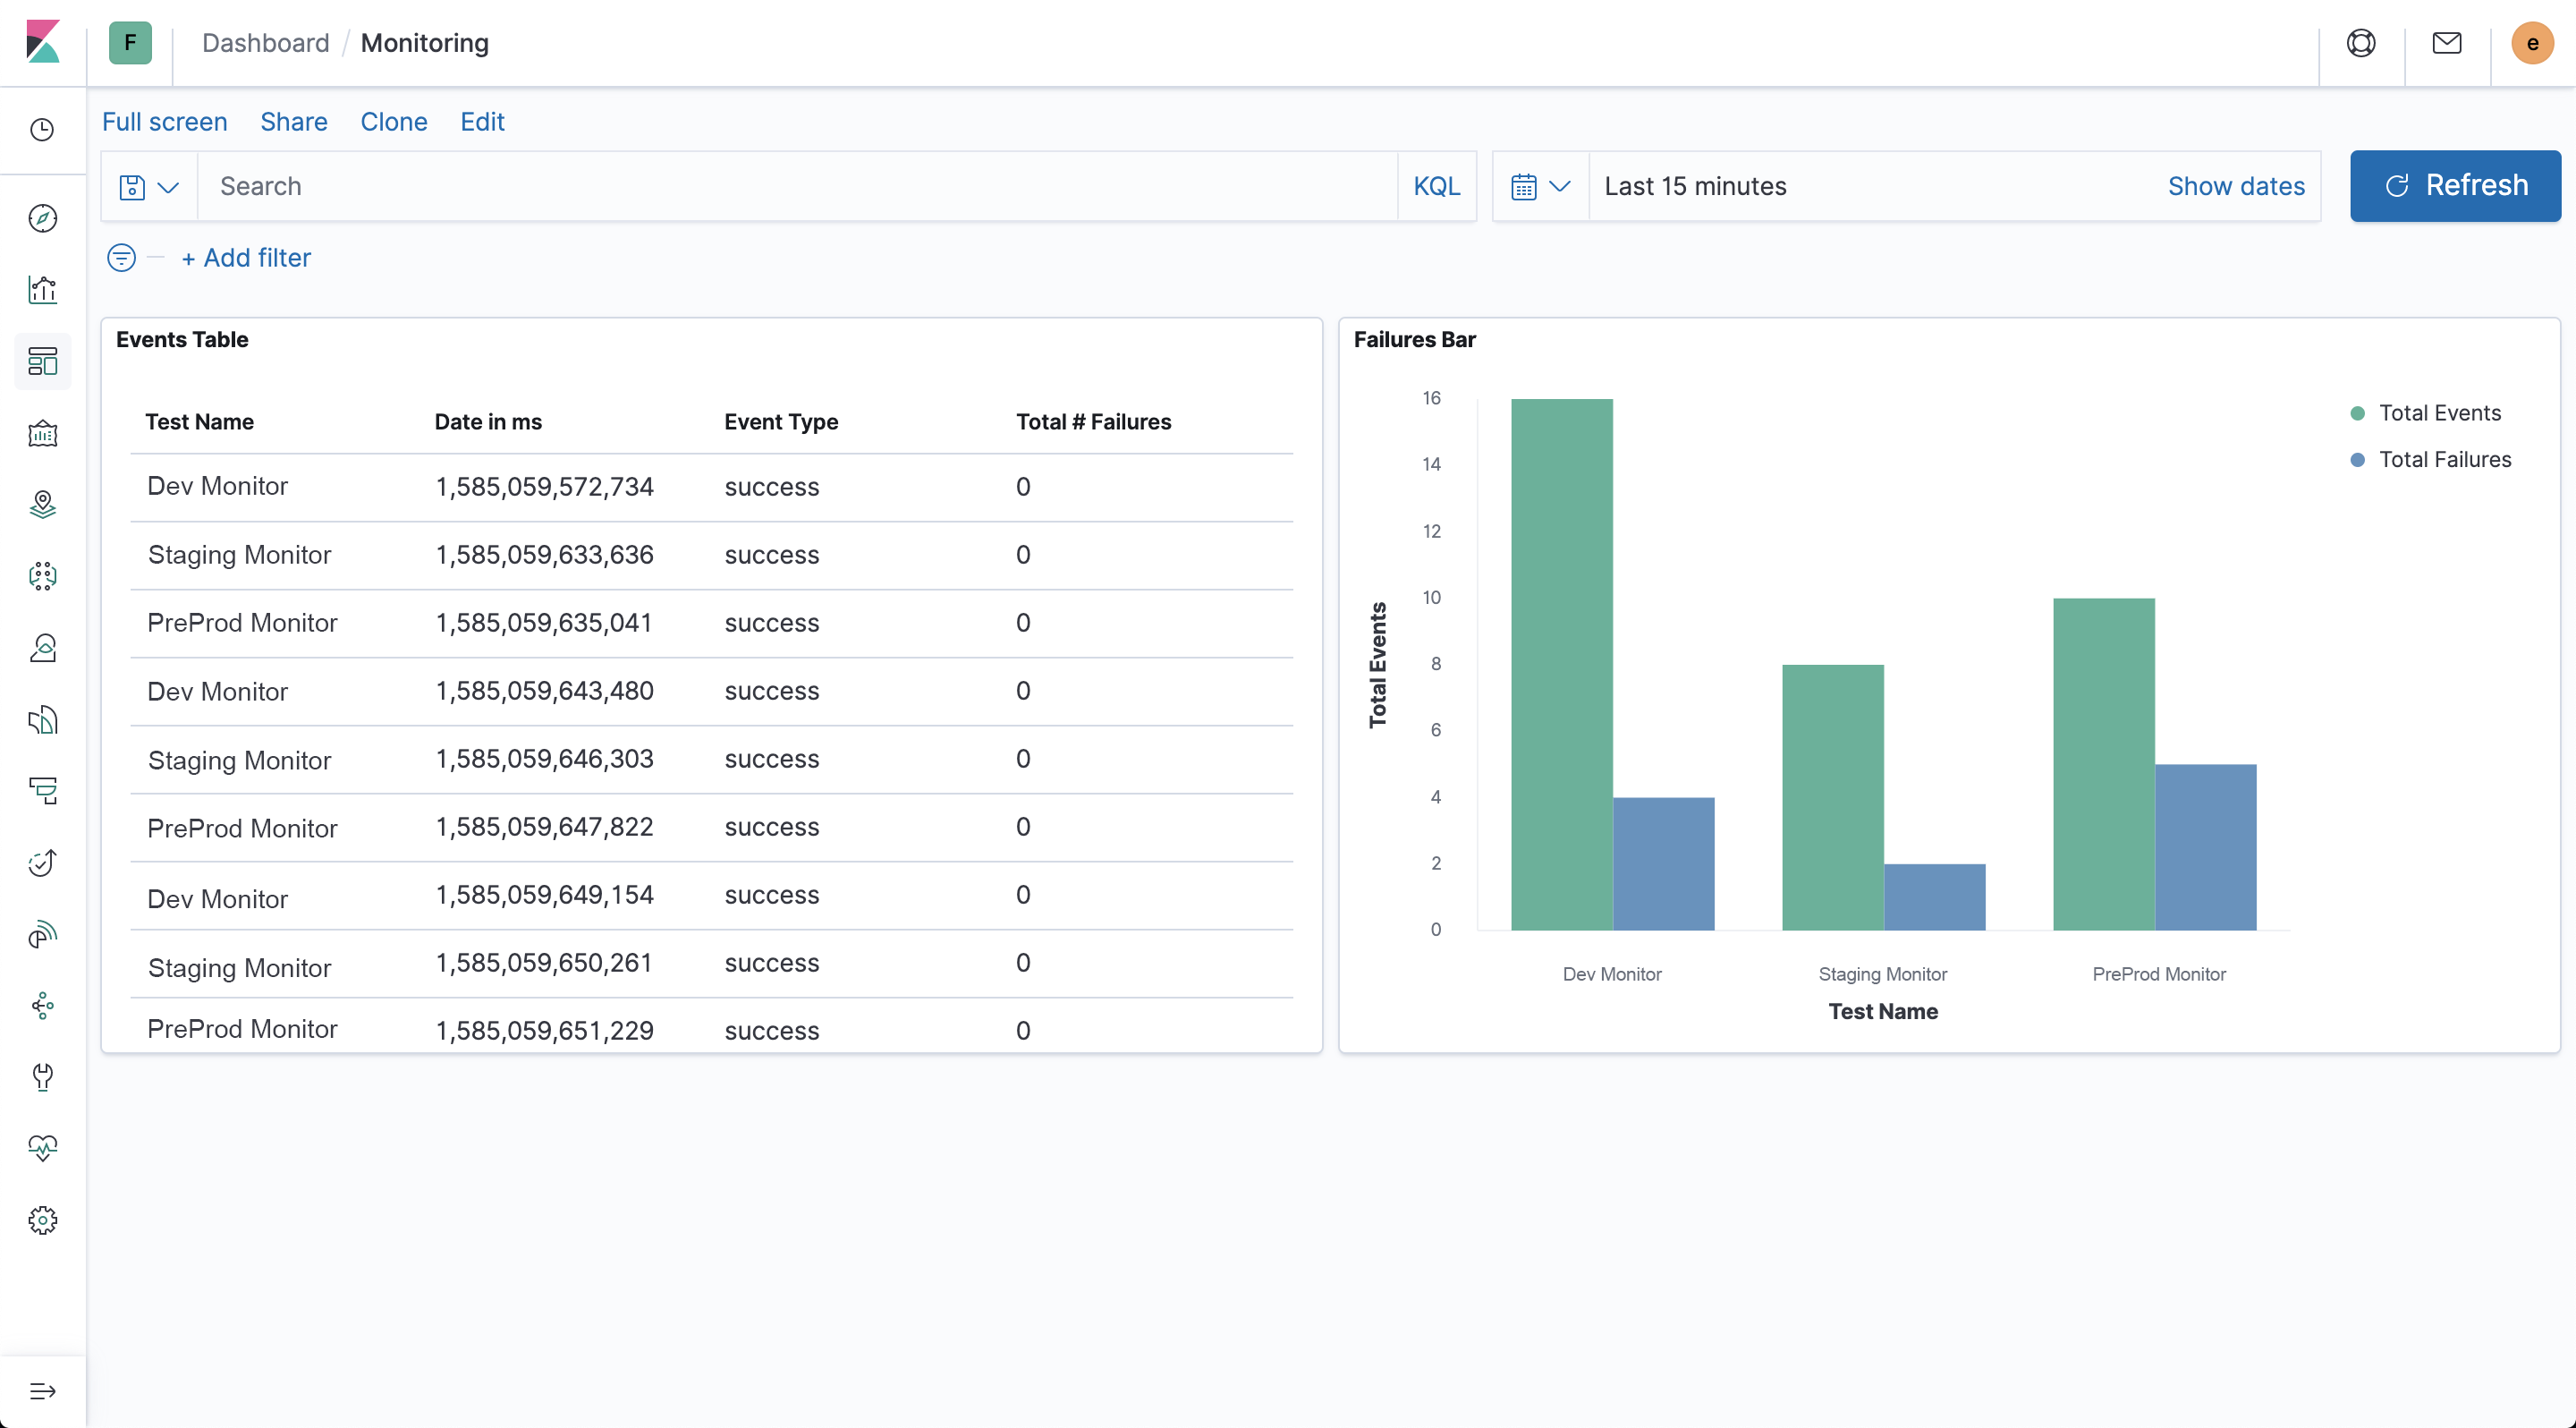
Then put it all together in a dashboard to make it really easy to monitor and track your test executions:
This API Fortress Helper utility allows you to access files via an API.
Configuration Deployment
Place the package in a machine that has access to the files that you wish to use, and could be reached by API Fortress as well via HTTP.
In the “docker-compose.yml” file customize the second volume to point to the directory you wish to share. The default is a local directory named “files”.
Access the files using the address:
http://<machine_hostname>:8091/files/<filename>
The default configuration has a demo file called bypopulation.csv, therefore by running the docker-compose.yml file, you should be able to access the file by calling:
http://<machine_hostname>:8091/files/bypopulation.csv
Running
As easy as “sudo docker-compose up -d”.
This API Fortress Helper utility allows you to access databases via an API.
Configuration Deployment
Place the package in a machine that has access to the databases that you wish to use, and which could be reached by API Fortress via HTTP.
As a default, the system will connect to PostgreSQL, but you can configure it to run against any DB that can be accessed with JDBC.
Of course, this requires a bit more configuration located in apps/db-api-helper/db-api-helper.xml. Next steps are pretty straight forward.
Look for the following element:
<db:generic-config name="Generic_Database_Configuration" url="jdbc:postgresql://172.28.0.1:5432/apipulse?password=jk5112&user=apipulse" driverClassName="org.postgresql.Driver" doc:name="Generic Database Configuration">
If you plan to use another database, you will need to download the matching JDBC driver, place it in the apps/db-api-helper/lib directory, and configure the flow accordingly.
In our example, hitting the route like this…
curl -H 'content-type:text/plain' -d '* from auser' http://<machine_hostname>:8092/db/select
…will trigger a select query that will return the result as a JSON array payload.
INSERT, UPDATE, DELETE routes are also available and they work similarly.
Running
It’s as easy as “sudo docker-compose up -d”.
***Self-Hosted/On-Premises only***
If you are using a
self-hosted/on-premises deployment and would like to set up single sign-on (SAML 2,.0) follow the below instructions.
Step 1: Activate it
Whether you’re using a docker-compose or a Kubernetes deployment, introduce the following environment variable:
Name: samlEnabled
Value: 'true'
Step 2: Configure it
The provided “saml/saml.properties” file contains all the configuration keys necessary to the SAML functionality.
onelogin.saml2.sp.entityid: identifies the SP
onelogin.saml2.sp.assertion_consumer_service.url: where the response from idp is returned after an authentication request onelogin.saml2.sp.single_logout_service.url: where the response from idp is returned after logout request
onelogin.saml2.idp.single_sign_on_service.url: where the SP will send the Authentication Request
onelogin.saml2.idp.single_logout_service.url: where the SP will send the logout request
onelogin.saml2.idp.x509cert: public x509 certificate of the IdP
Example:
onelogin.saml2.sp.entityid = apifortress
onelogin.saml2.sp.assertion_consumer_service.url = http://apif.example.com:8080/app/web/login/acs
onelogin.saml2.sp.single_logout_service.url = http://apif.example.com:8080/app/web/login/sls
onelogin.saml2.idp.entityid = https://app.onelogin.com/saml/metadata/7037e41d-4ab4-417a-b0a2-c4e2f580faf2
onelogin.saml2.idp.single_sign_on_service.url = https://apifortress.onelogin.com/trust/saml2/http-post/sso/917654
onelogin.saml2.idp.single_logout_service.url = https://apifortress.onelogin.com/trust/saml2/http-redirect/slo/917654
onelogin.saml2.idp.x509cert = -----BEGIN CERTIFICATE-----CERTIFICATE HASH-----END CERTIFICATE-----
Further changes can be applied to the expected properties:
apifortress.firstname=FIRSTNAME
apifortress.lastname=LASTNAME
apifortress.mail=MAIL
In IDP one of MANAGER,DEVELOPER,ANALYST:
apifortress.level=LEVEL
By altering these configuration keys, you change the name of the property that’s being sent by the IDP. As a default, the required properties are:
FIRSTNAME,
LASTNAME,
MAIL, and LEVEL (which represents the level of the user within API Fortress and can be one of the following values: MANAGER, DEVELOPER, or ANALYST. If the field is not provided, MANAGER is assumed.
The admin status can only be set via the API Fortress configuration panel.)
Note: there may be other configuration keys to be altered based on the IDP requirements.
Step 3: Mount it
Mount the provided “saml” directory to the location: /usr/local/tomcat/webapps/app/WEB-INF/saml
If Kubernetes is being used, ConfigMaps will achieve the same result.
Step 4: Restart API Fortress
Restart the API Fortress dashboard(s).
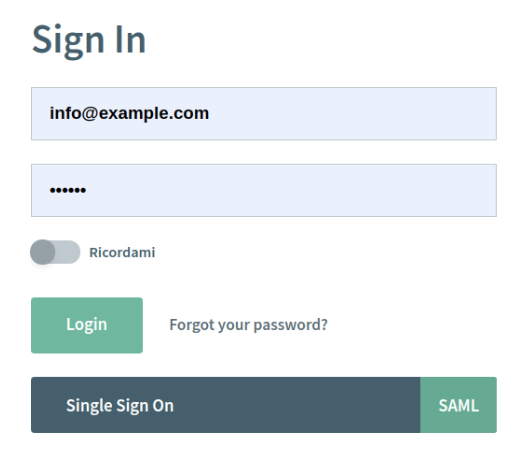
The login screen will now look like this:
**To learn how to import a connector click here**
This connector allows you to connect your API Fortress instance with your StatusPage instance. When a test fails the connector will open an incident in StatusPage, the next time that same test runs and passes the connector will resolve the incident in StatusPage.
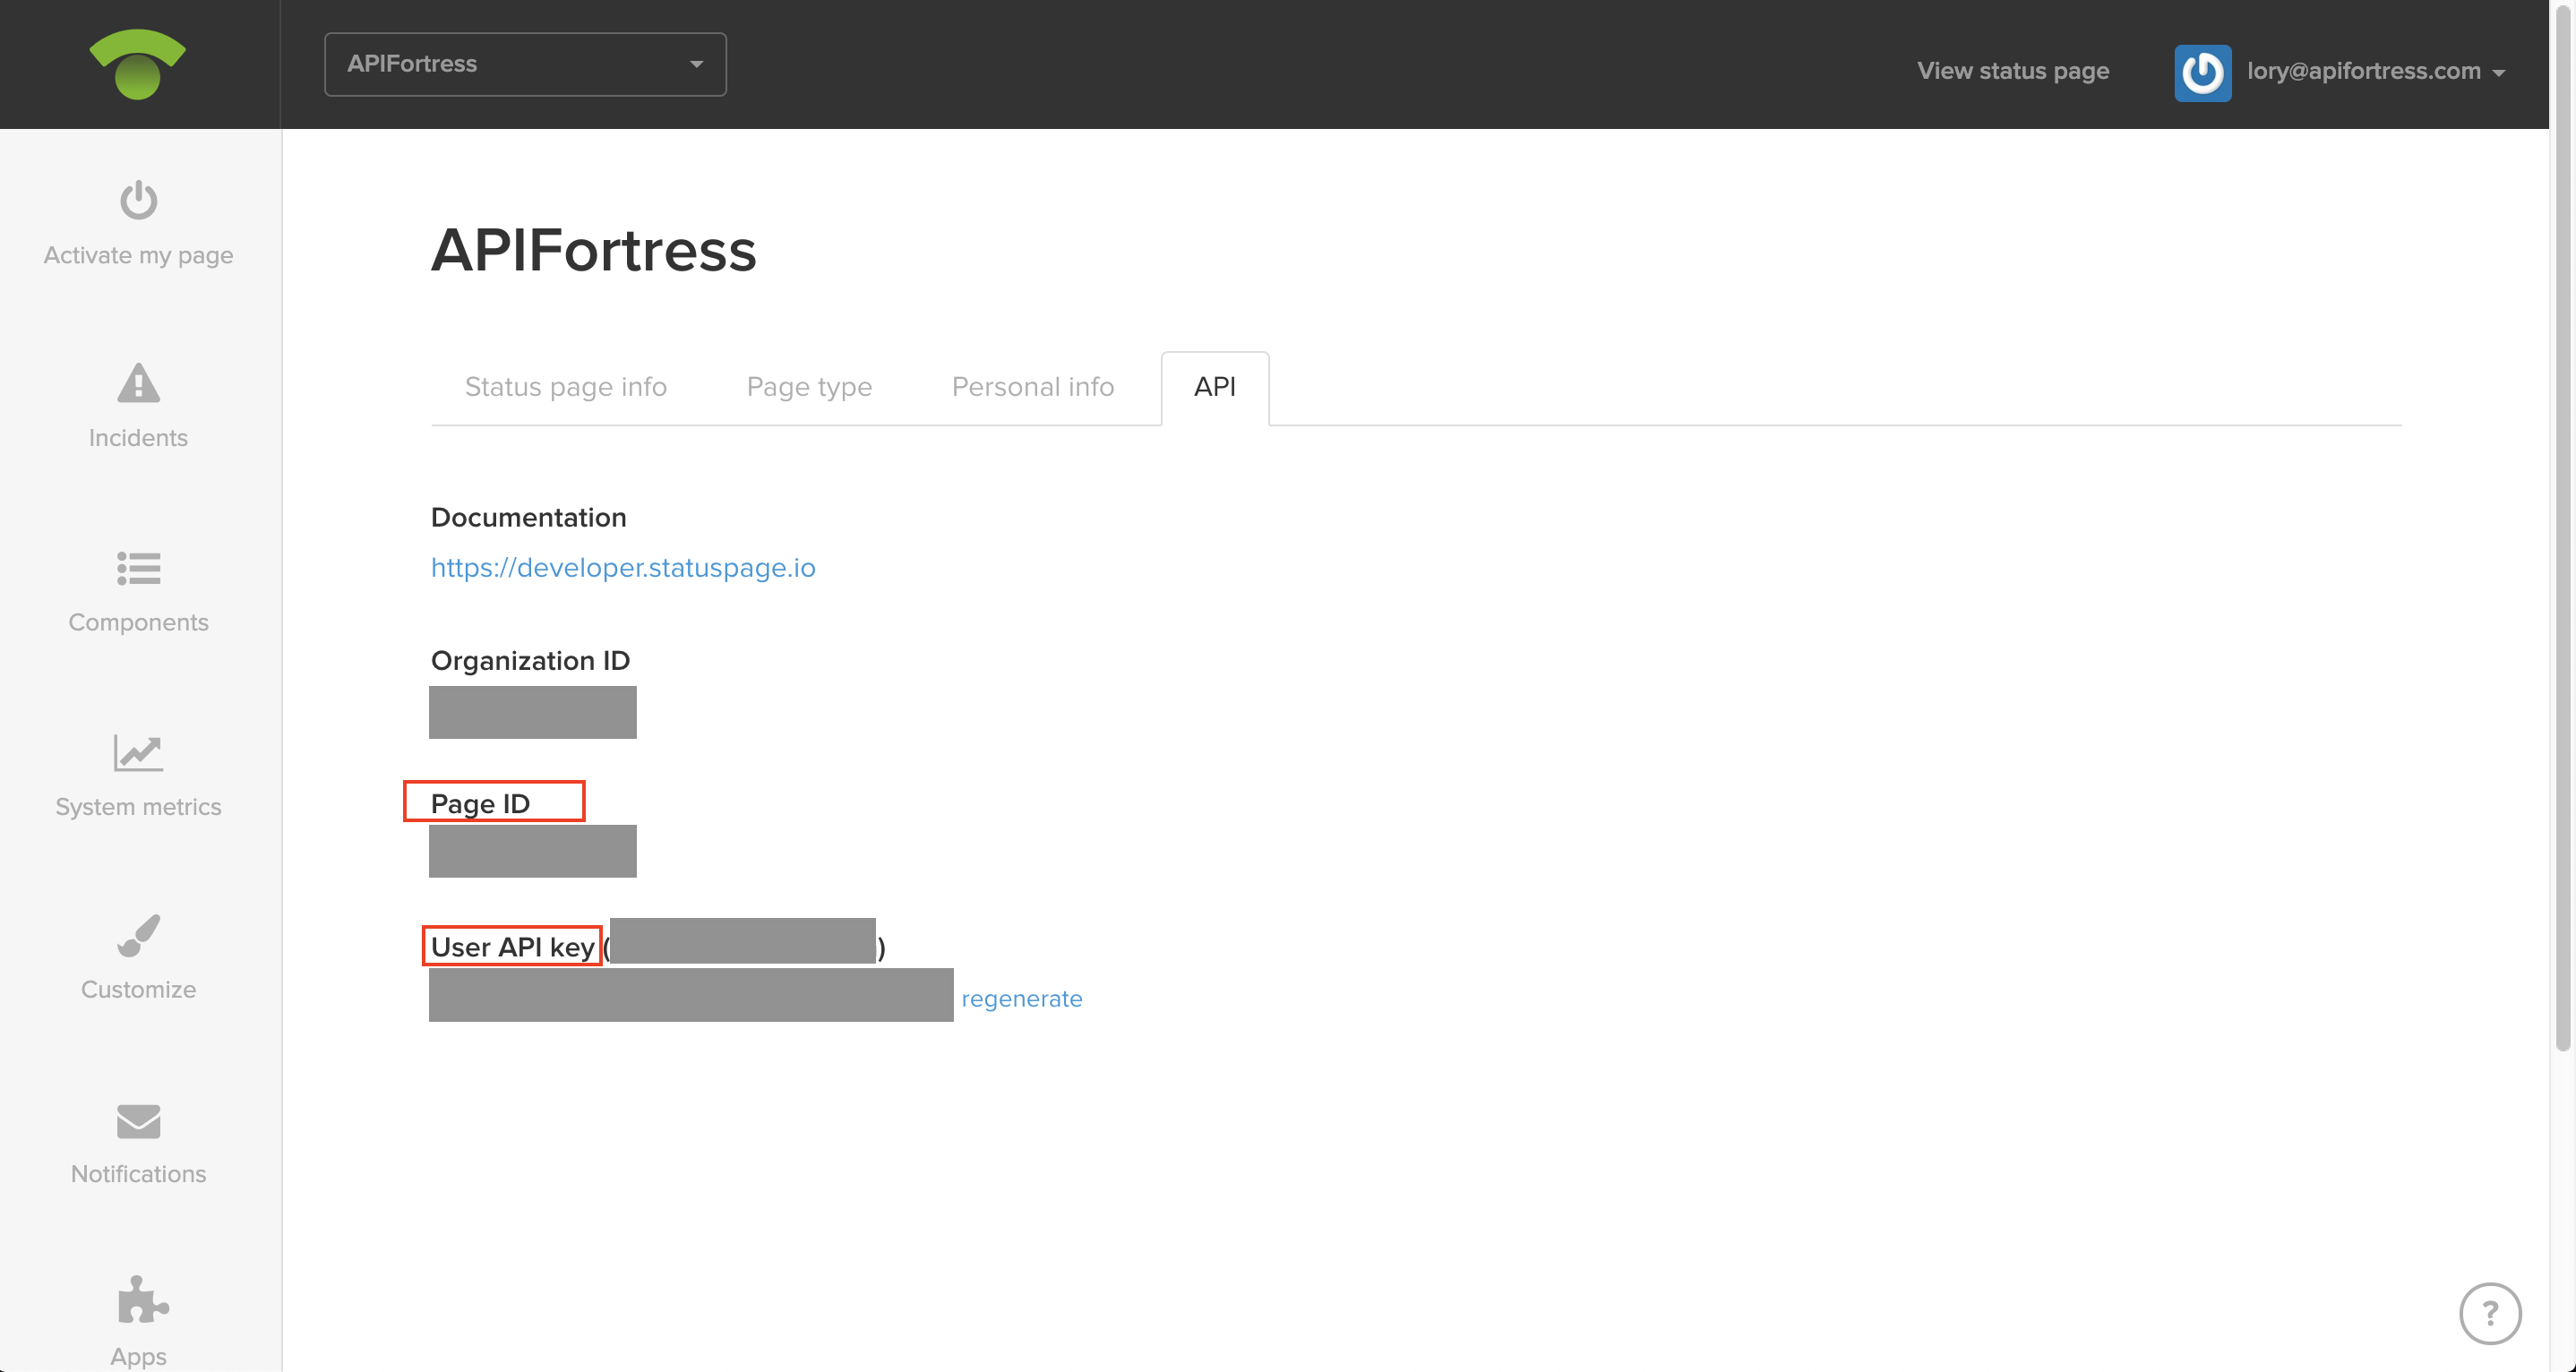
What you will need from your Status page account is the Page ID and the API key, both can be found by logging into your StatusPage account and going to the manage account page. Then click on the tab names “API”:
Next we will configure the connector in API Fortress:
Don’t forget to add the alert group the project you want the connector to work for:
We now have an integration built out with Curiosity Software’s Test Modeller. This integration allows you to power your API Fortress tests with modeled data that was generated in TDM.
Below are the steps to integrate TDM with APIF:
API Fortress:
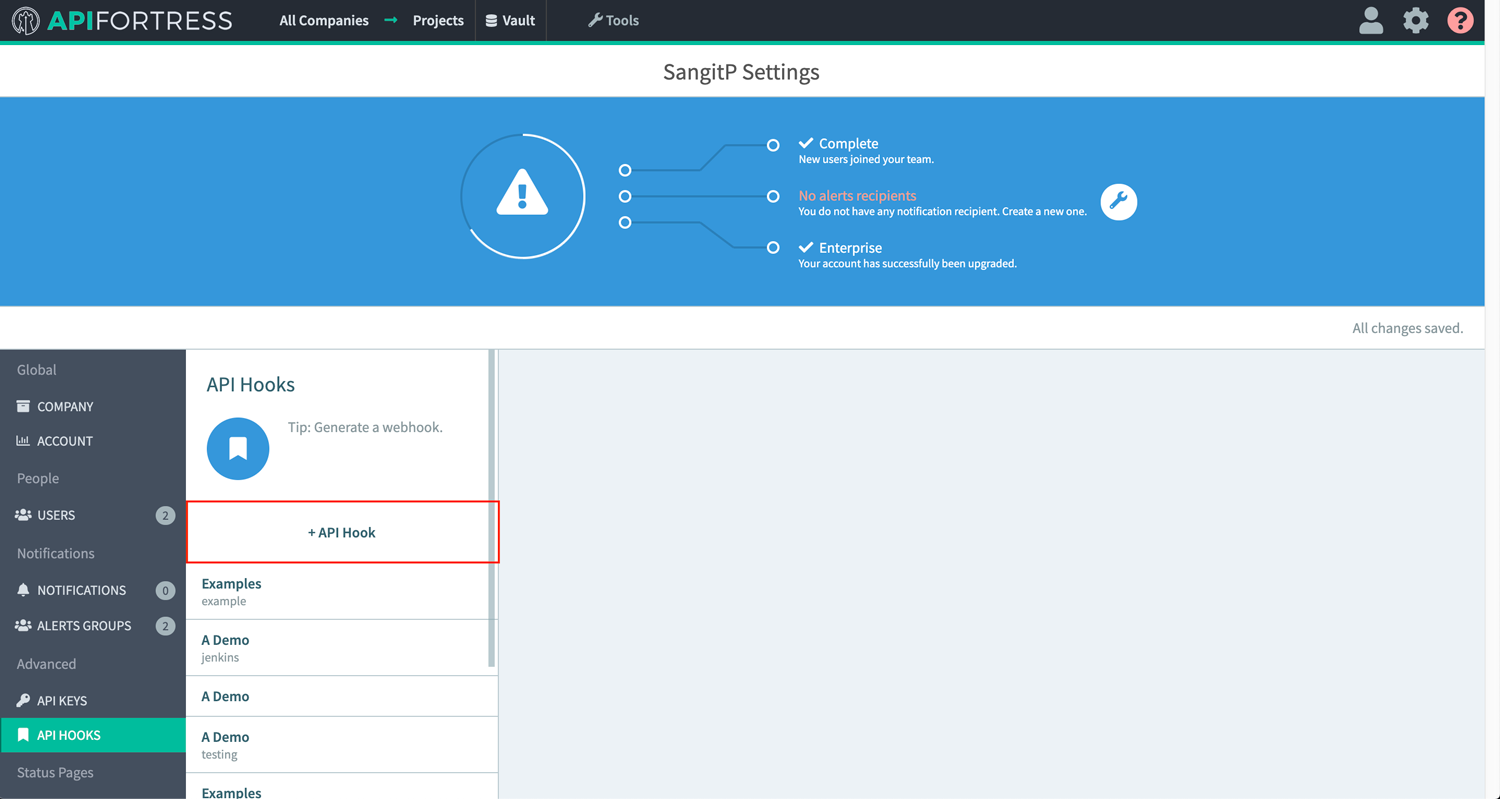
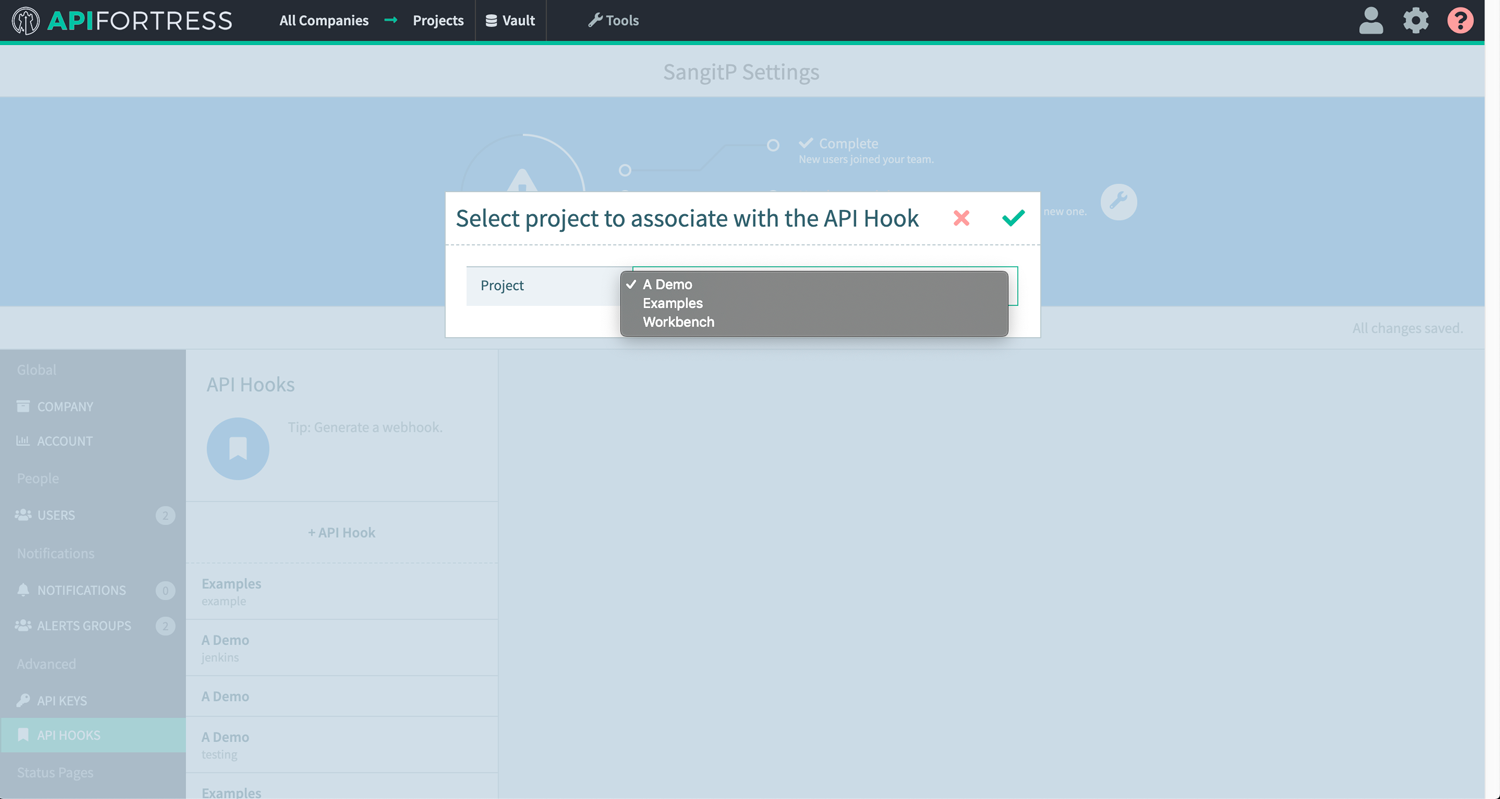
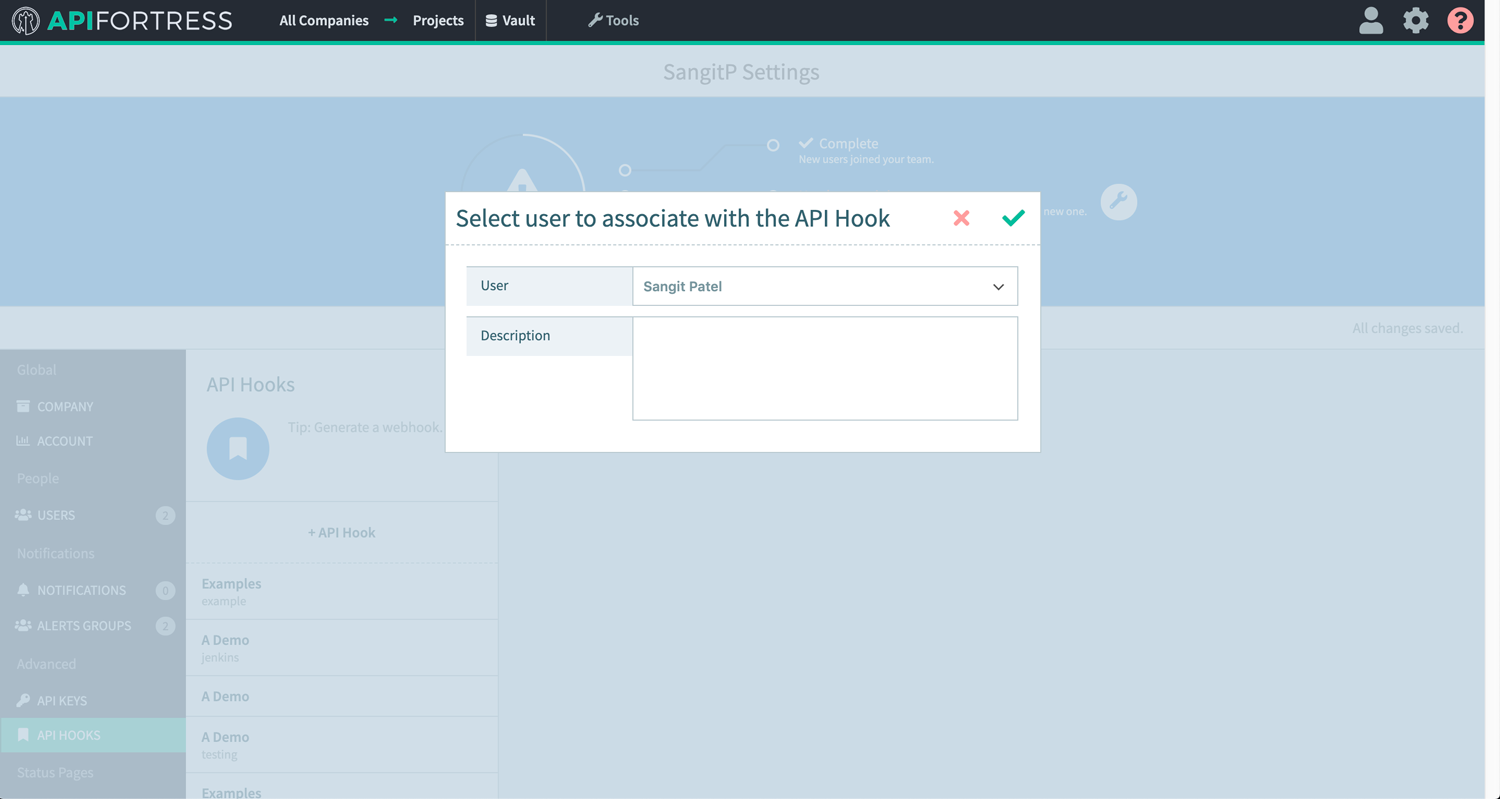
- Create an API Fortress test that will be used with TDM data.
- Generate Webhook for project that will use TDM data:
- Test Modeller:
1. Go to Profile -> Connectors
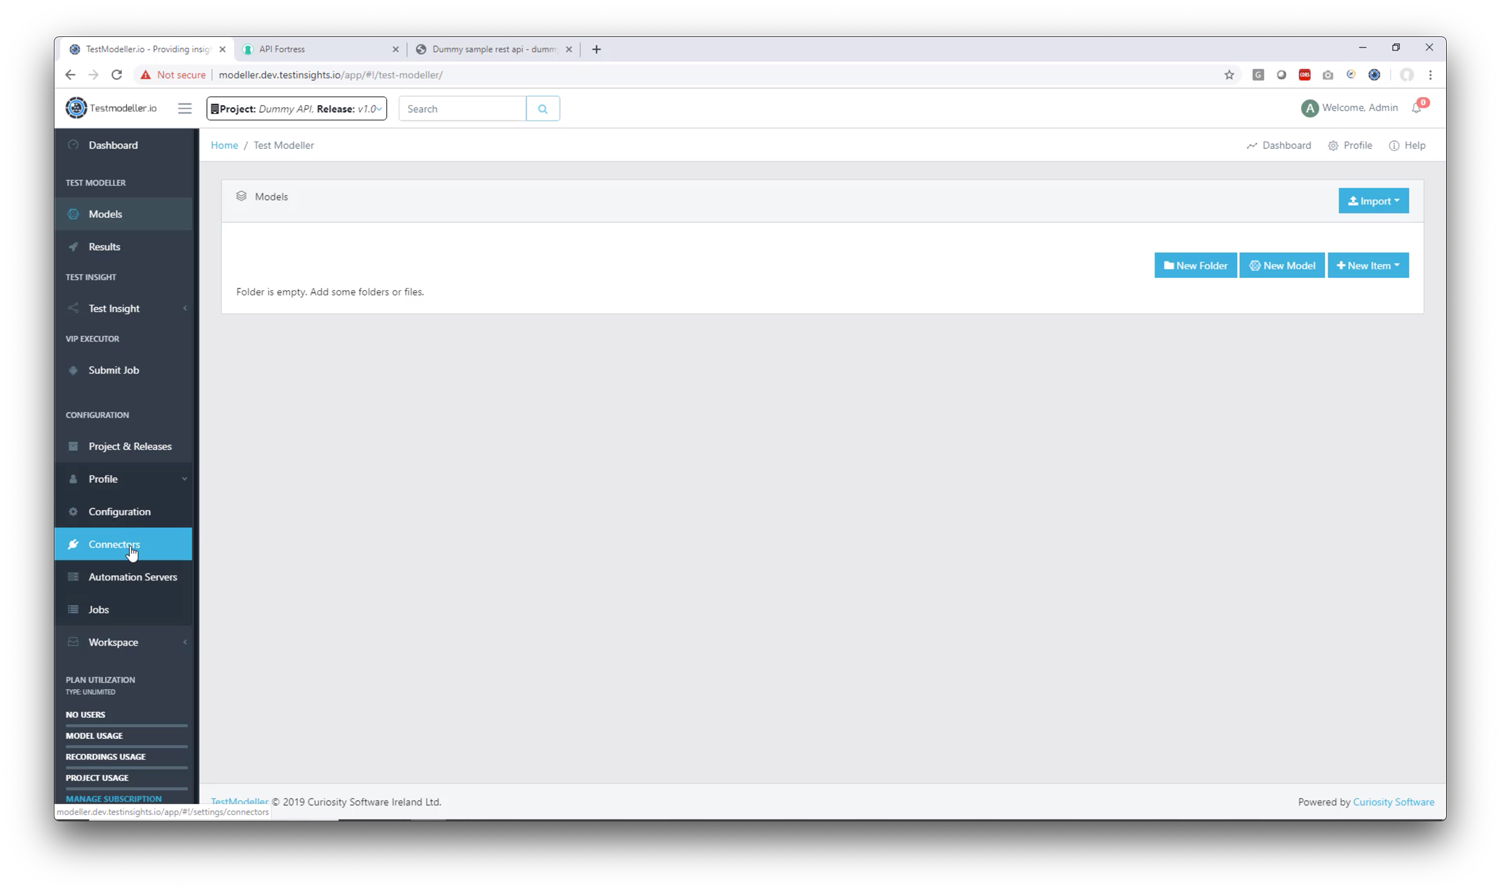 2. Click “Add Connection”
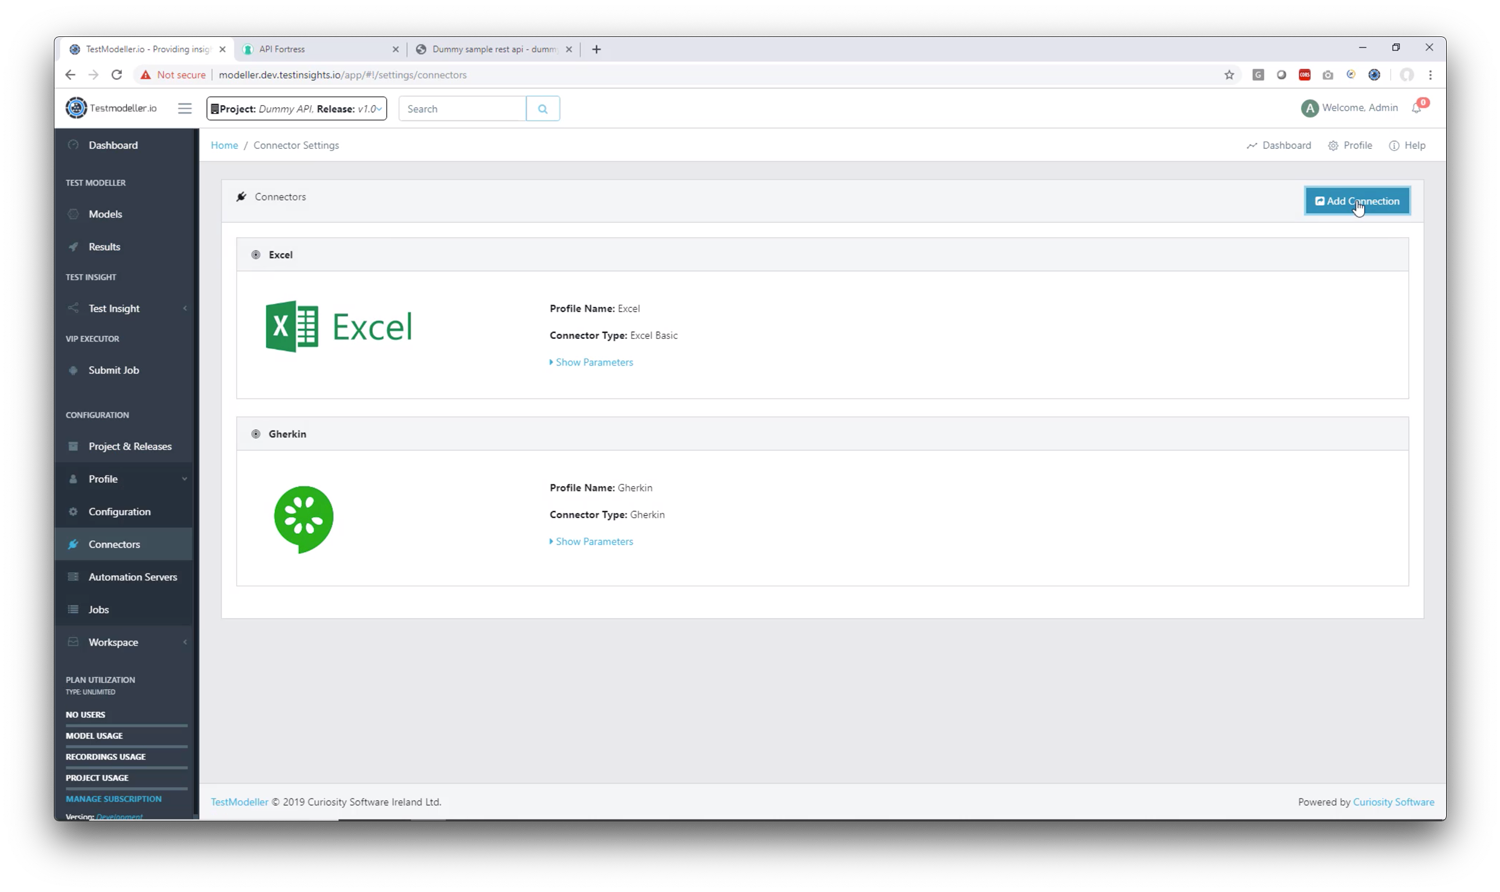 3. Set up the API Fortress connector in Test Modeller
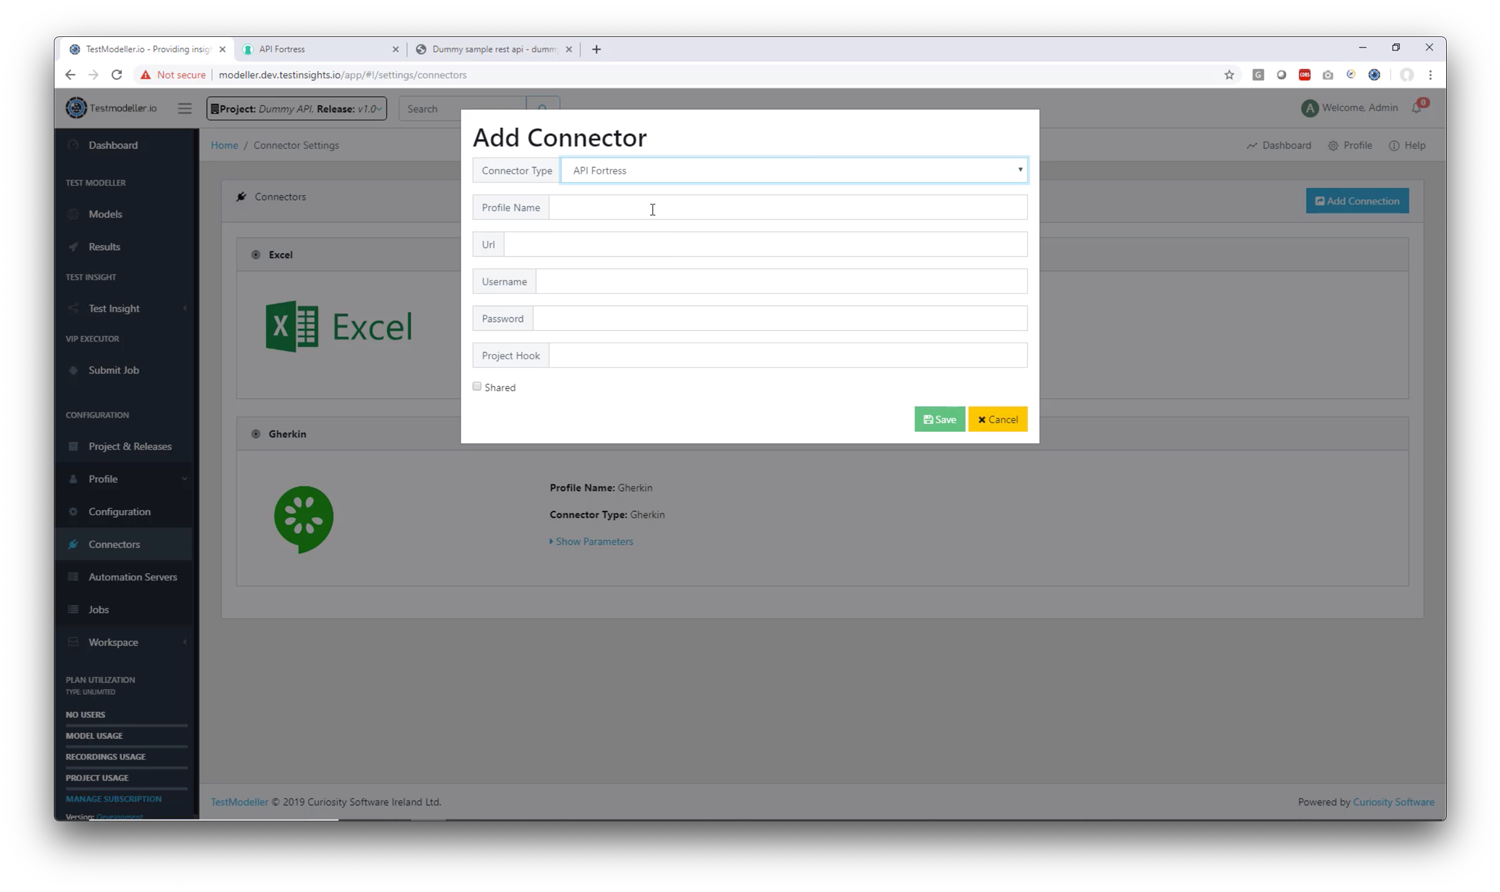 1. Connector Type: choose API Fortress
2. Profile Name: Give the profile a name (recommendation: this should match the API Fortress project name for organizational purposes)
3. Url: This is your API Fortress domain up to the “/app” part (example: https://mastiff.apifortress.com/app/)
4. Username: This is your API Fortress login username
5. Password: This is your API Fortress login password
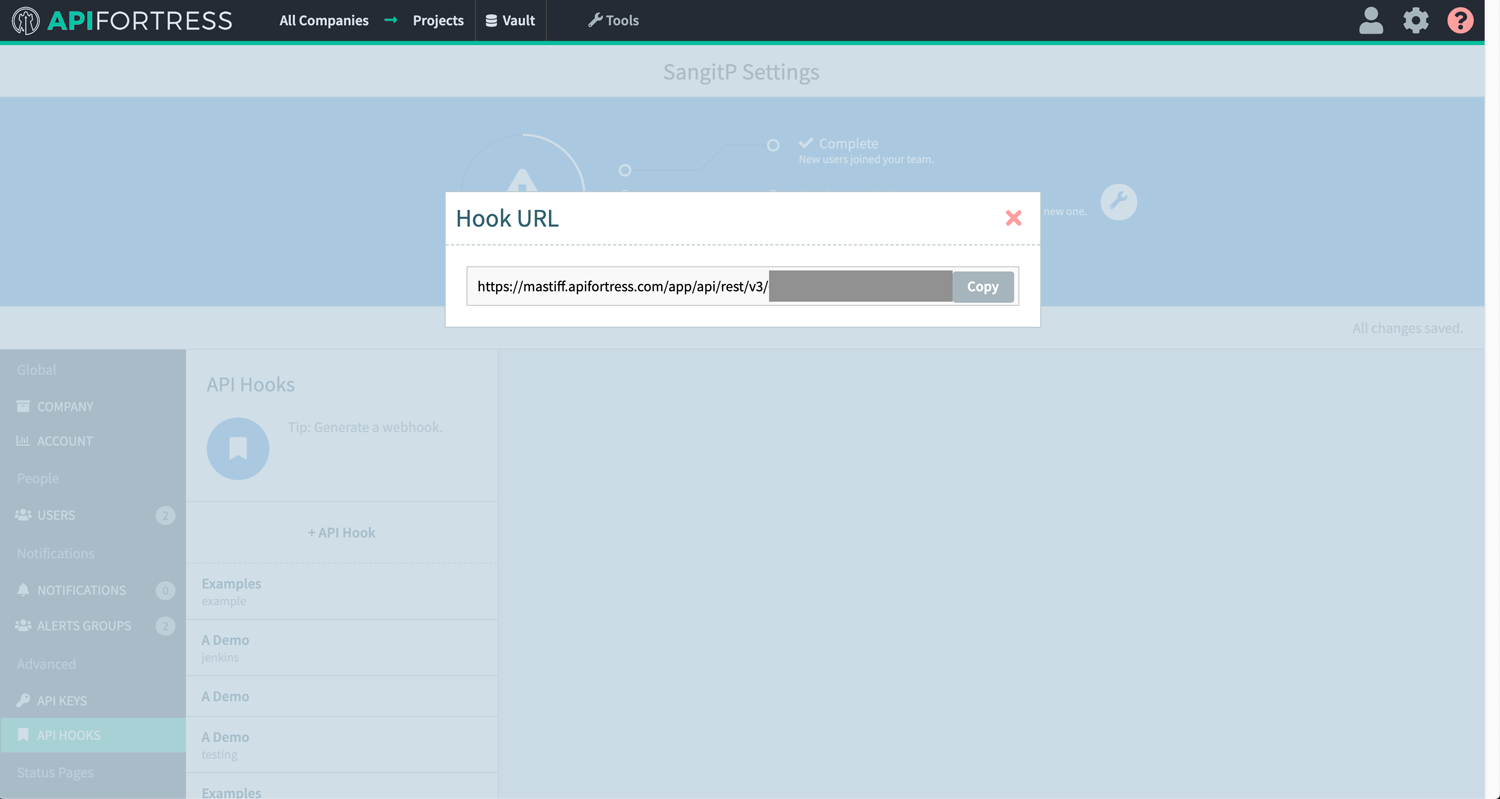
6. Project Hook: This is the API Fortress hook that we created earlier in API Fortress. (use the string at the end of the url, for example https://mastiff.apifortress.com/app/api/rest/v3/xxxxxxxx-xxxx-xxxx-xxxx-xxxxxxxxxxxxxxx
1. Connector Type: choose API Fortress
2. Profile Name: Give the profile a name (recommendation: this should match the API Fortress project name for organizational purposes)
3. Url: This is your API Fortress domain up to the “/app” part (example: https://mastiff.apifortress.com/app/)
4. Username: This is your API Fortress login username
5. Password: This is your API Fortress login password
6. Project Hook: This is the API Fortress hook that we created earlier in API Fortress. (use the string at the end of the url, for example https://mastiff.apifortress.com/app/api/rest/v3/xxxxxxxx-xxxx-xxxx-xxxx-xxxxxxxxxxxxxxx
4. Save the connector
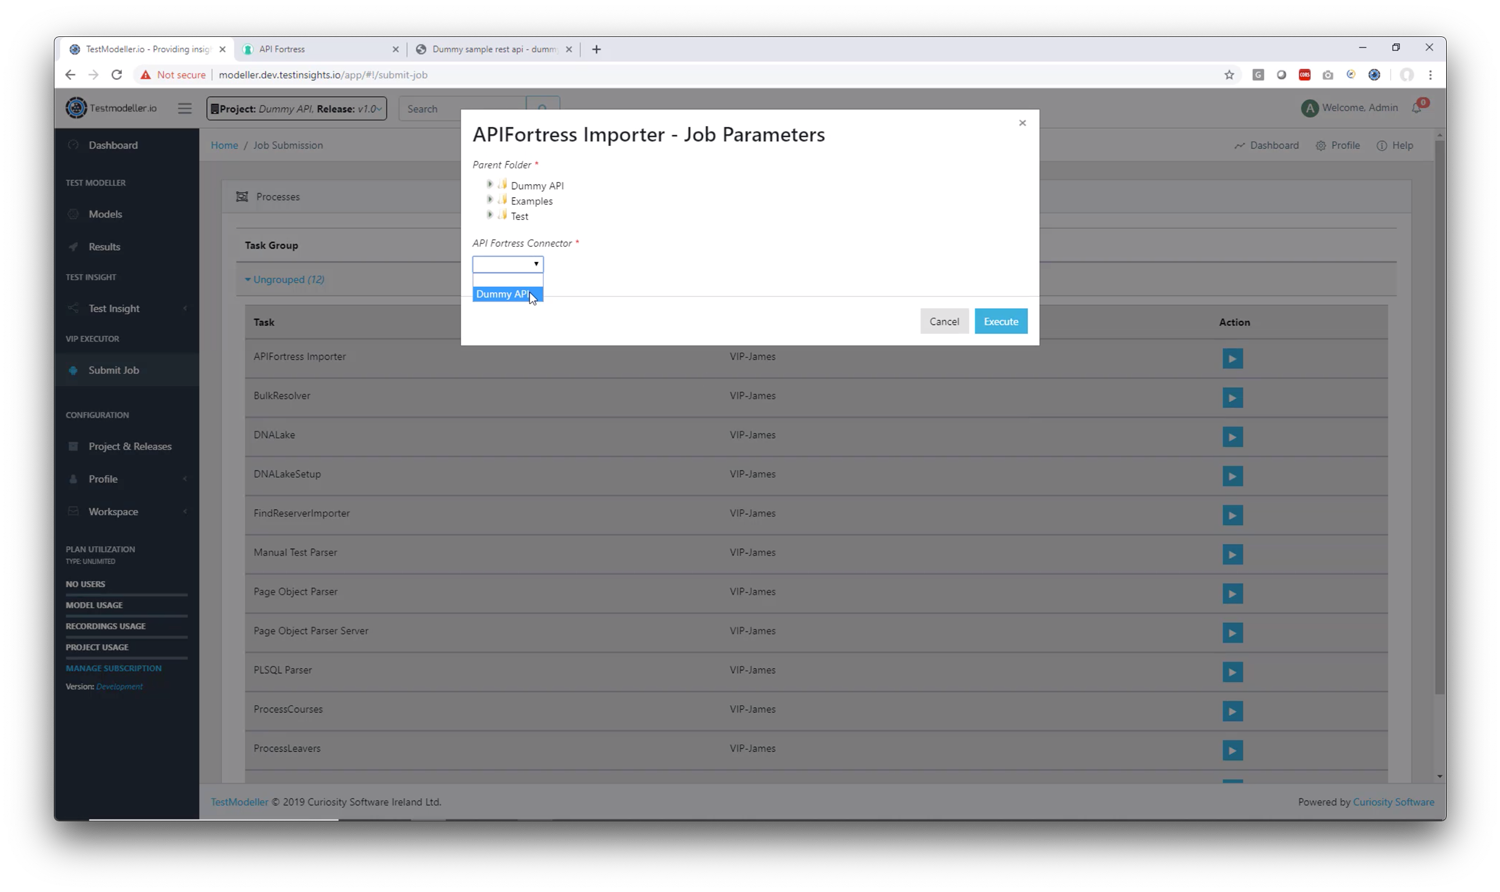
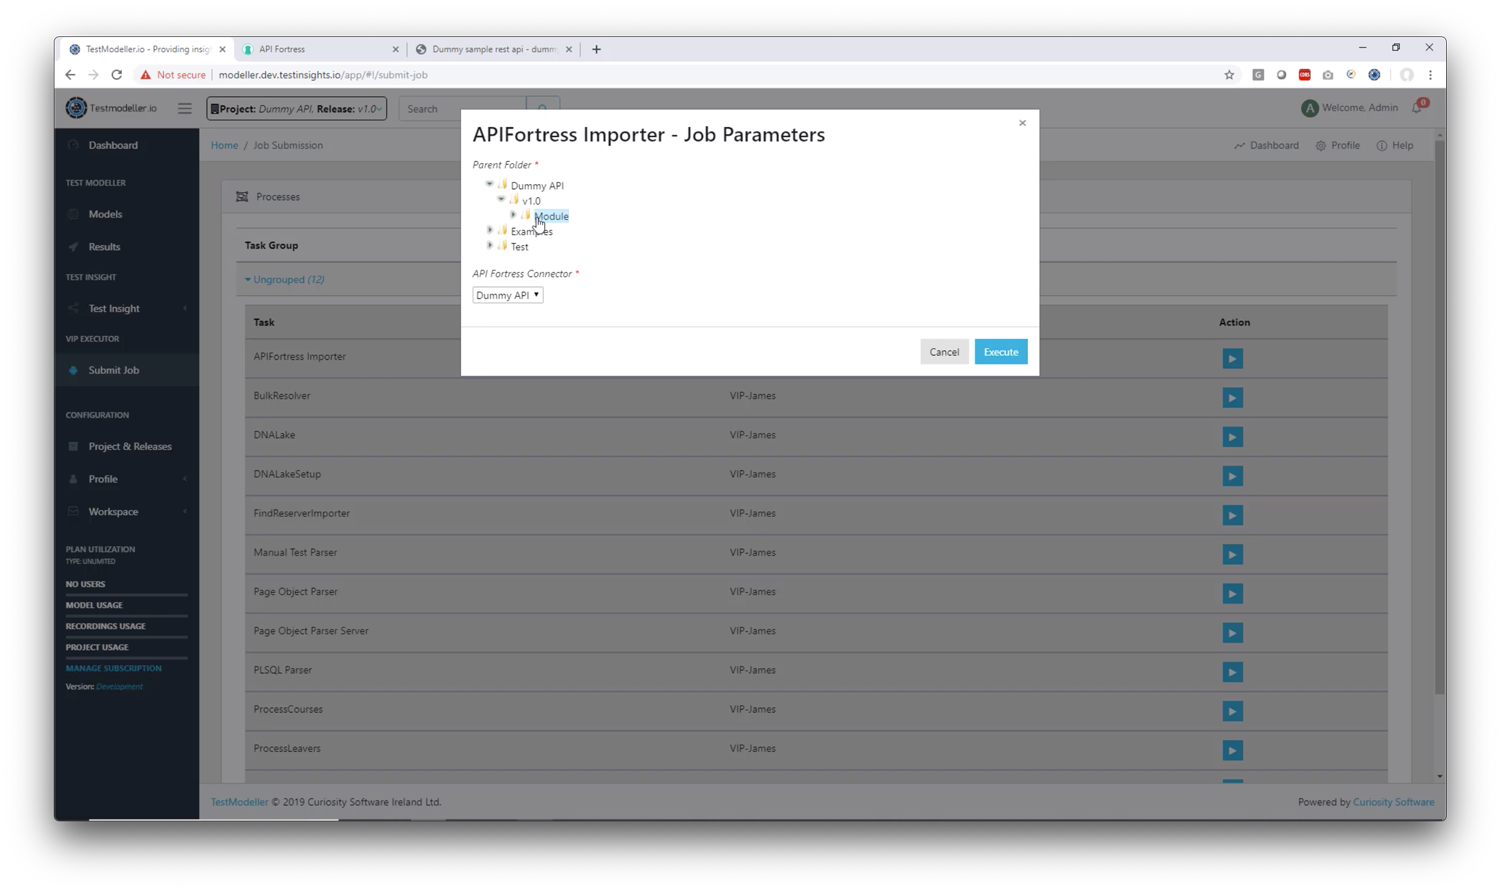
5. Now that the connector has been configured, go to the “Submit Job” tab
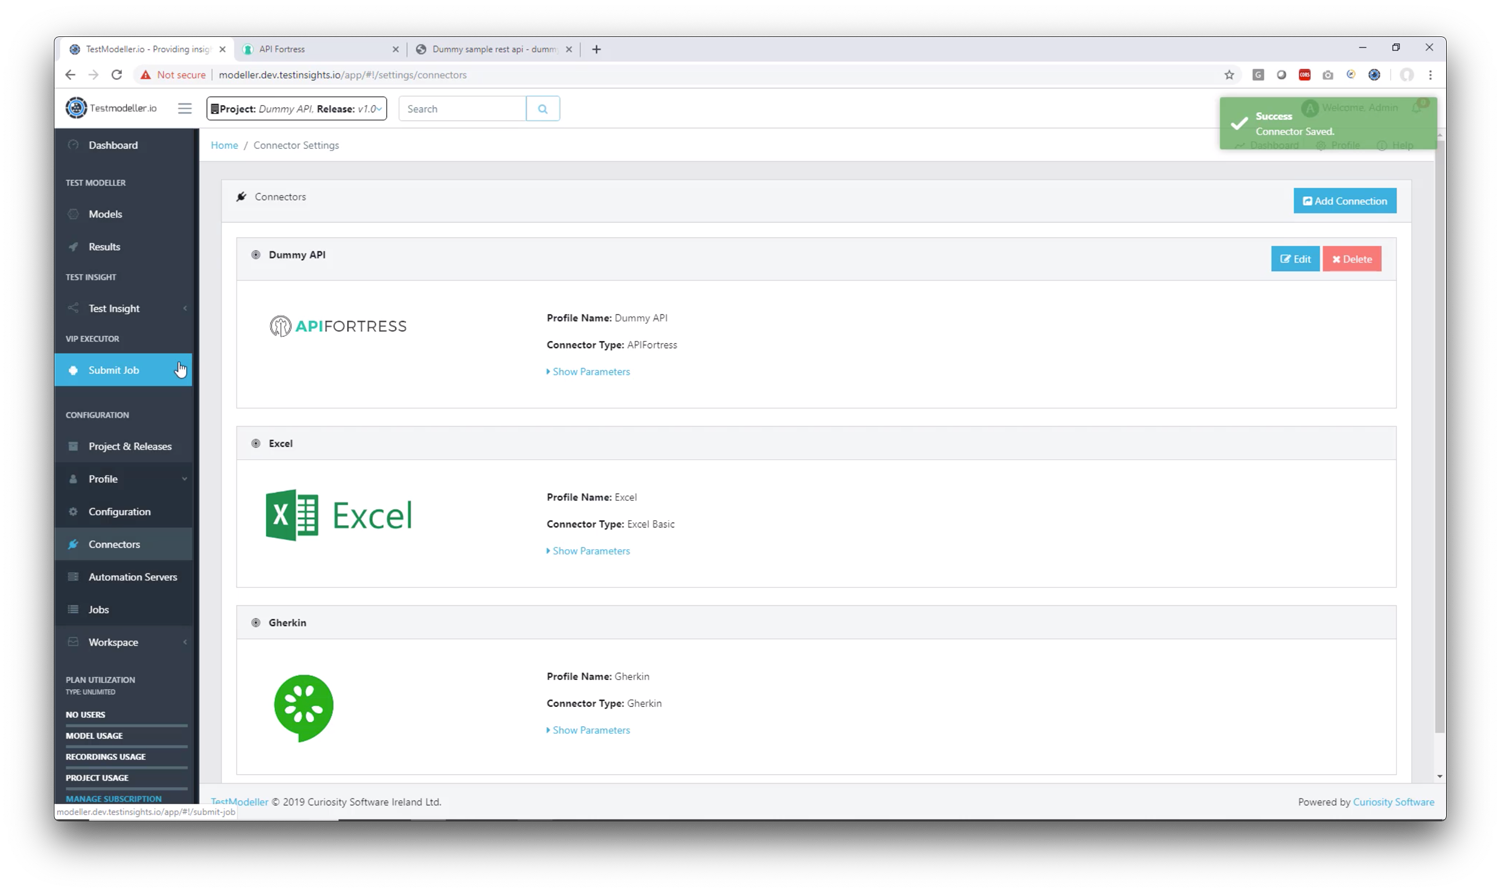
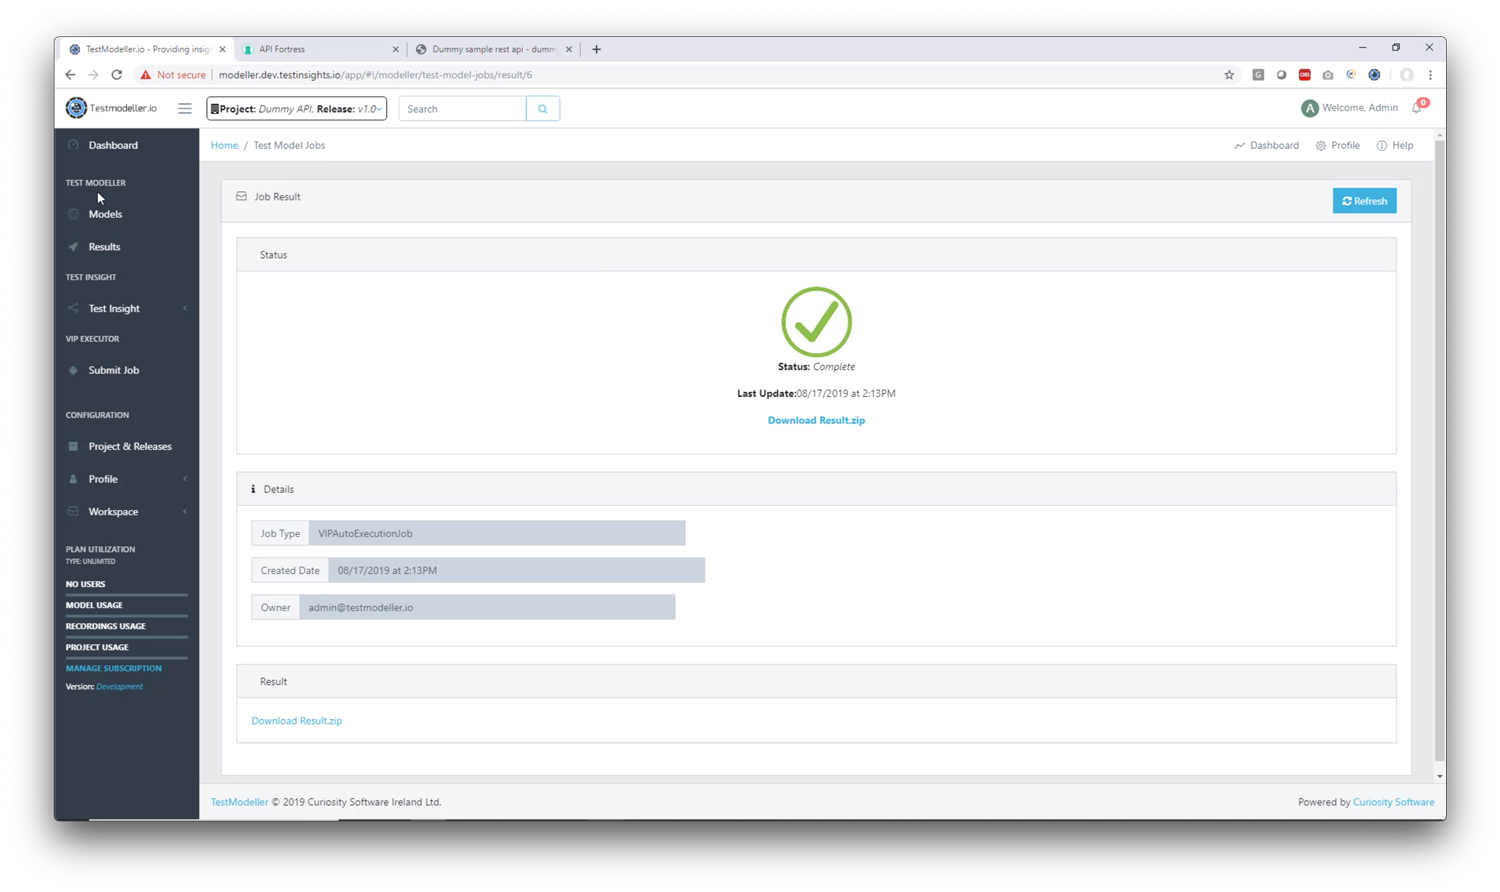
6. Find the API Fortress job and execute it
Now you have your integration between TDM and API Fortress complete, create some models and run tests with multiple input sets easily!
To watch a video on this process including how to create model and push data to APIF and run the test click here.