
Below is a quick guide to setting up and using the Splunk connector.
Note: this connector does not come preloaded out of the box, and will need to be loaded separately. To learn how to load the connector into your API Fortress instance click here.
Configure the Connector
Note: You can click on the screenshots to zoom in.
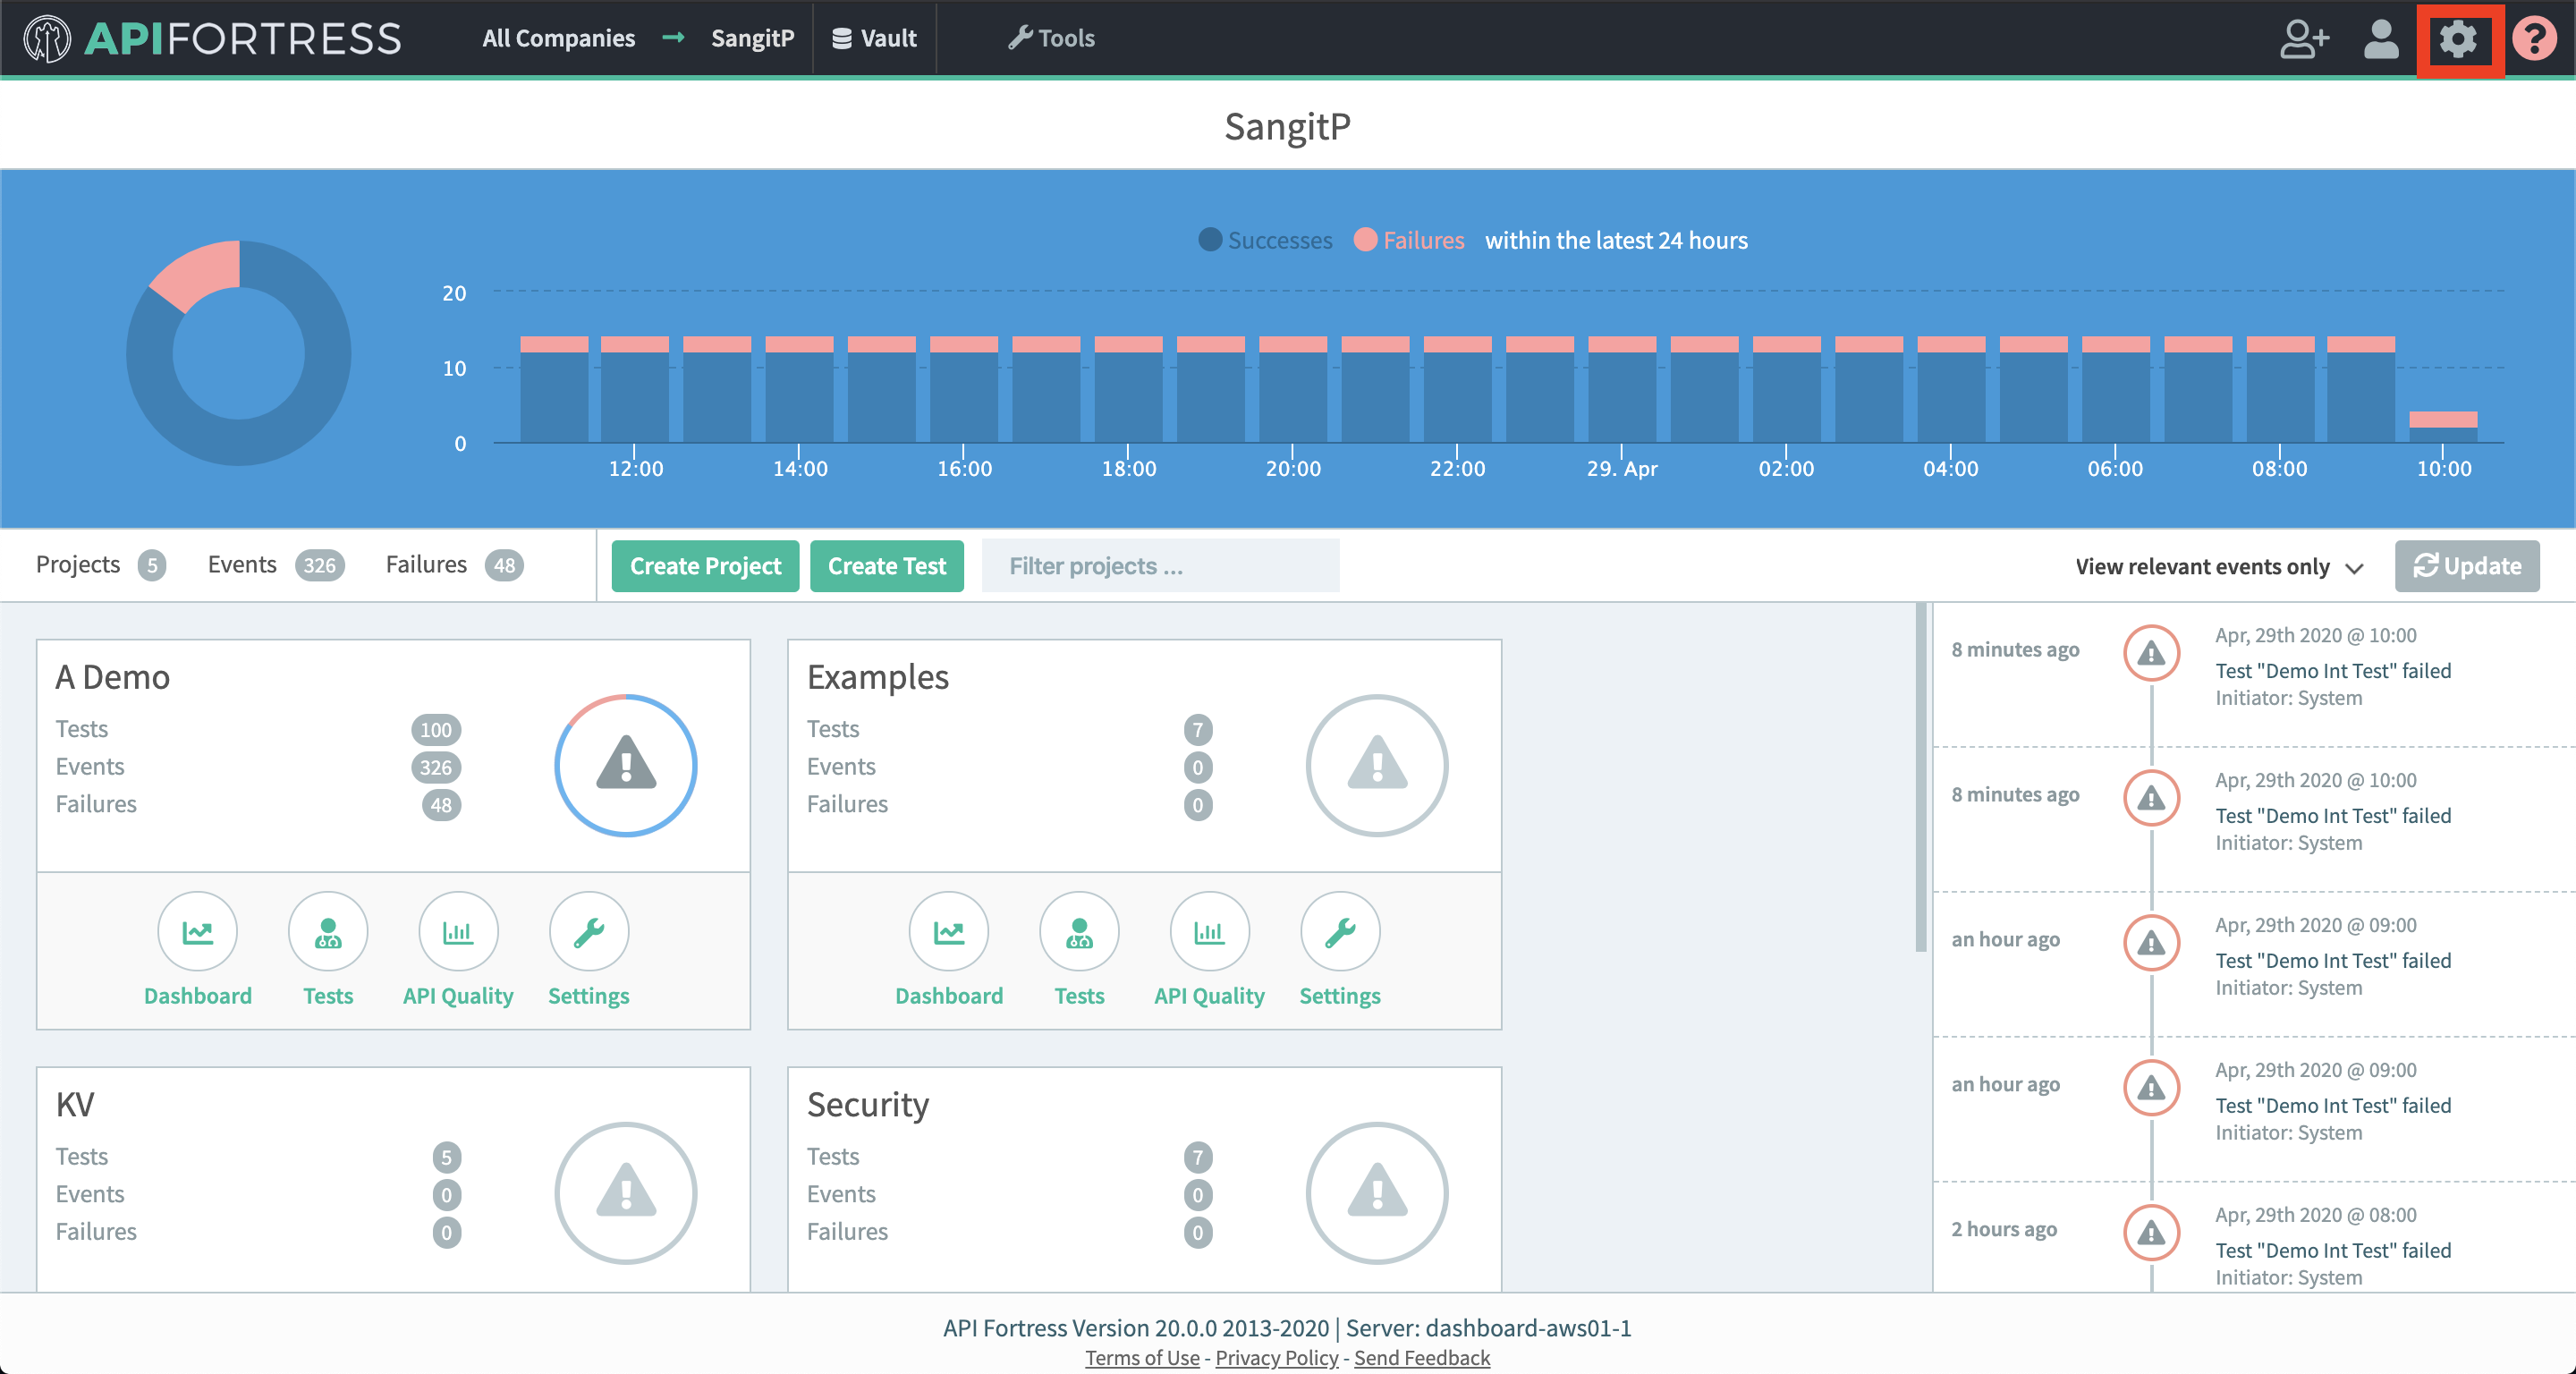
- Access the company dashboard by clicking the gear icon in the top right corner
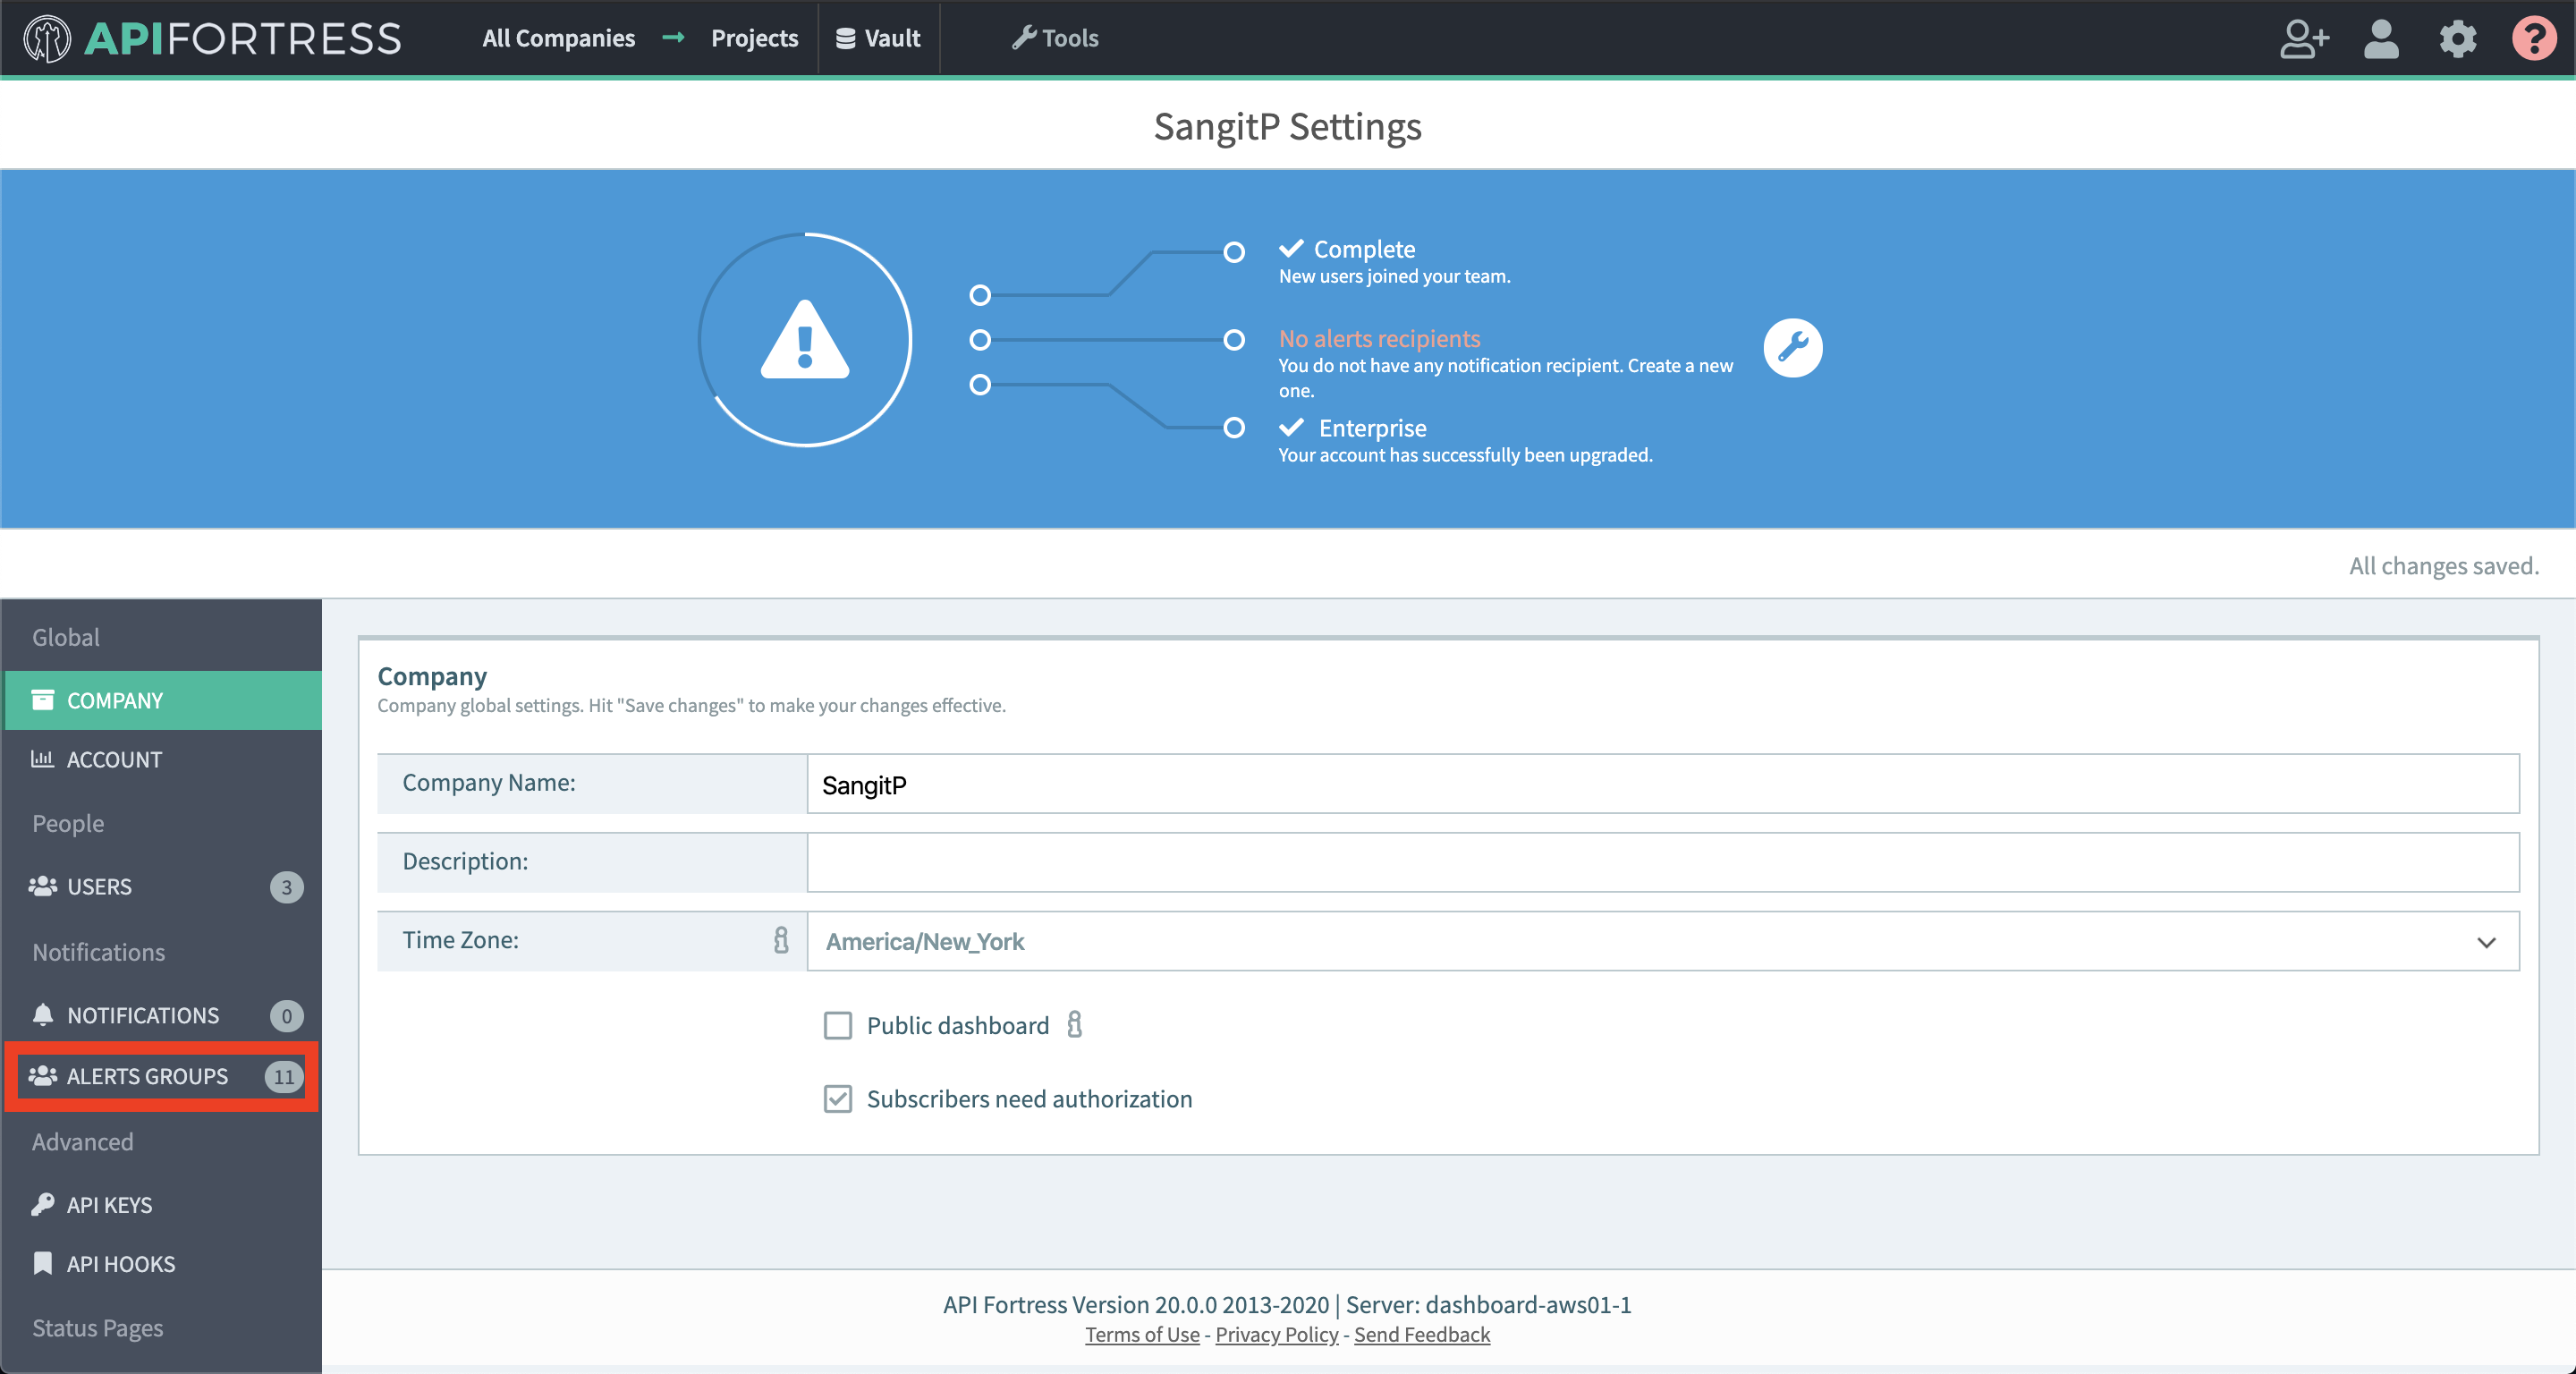
- Click on “Alert Groups”
- Create a new group or add a connector to an existing alert group
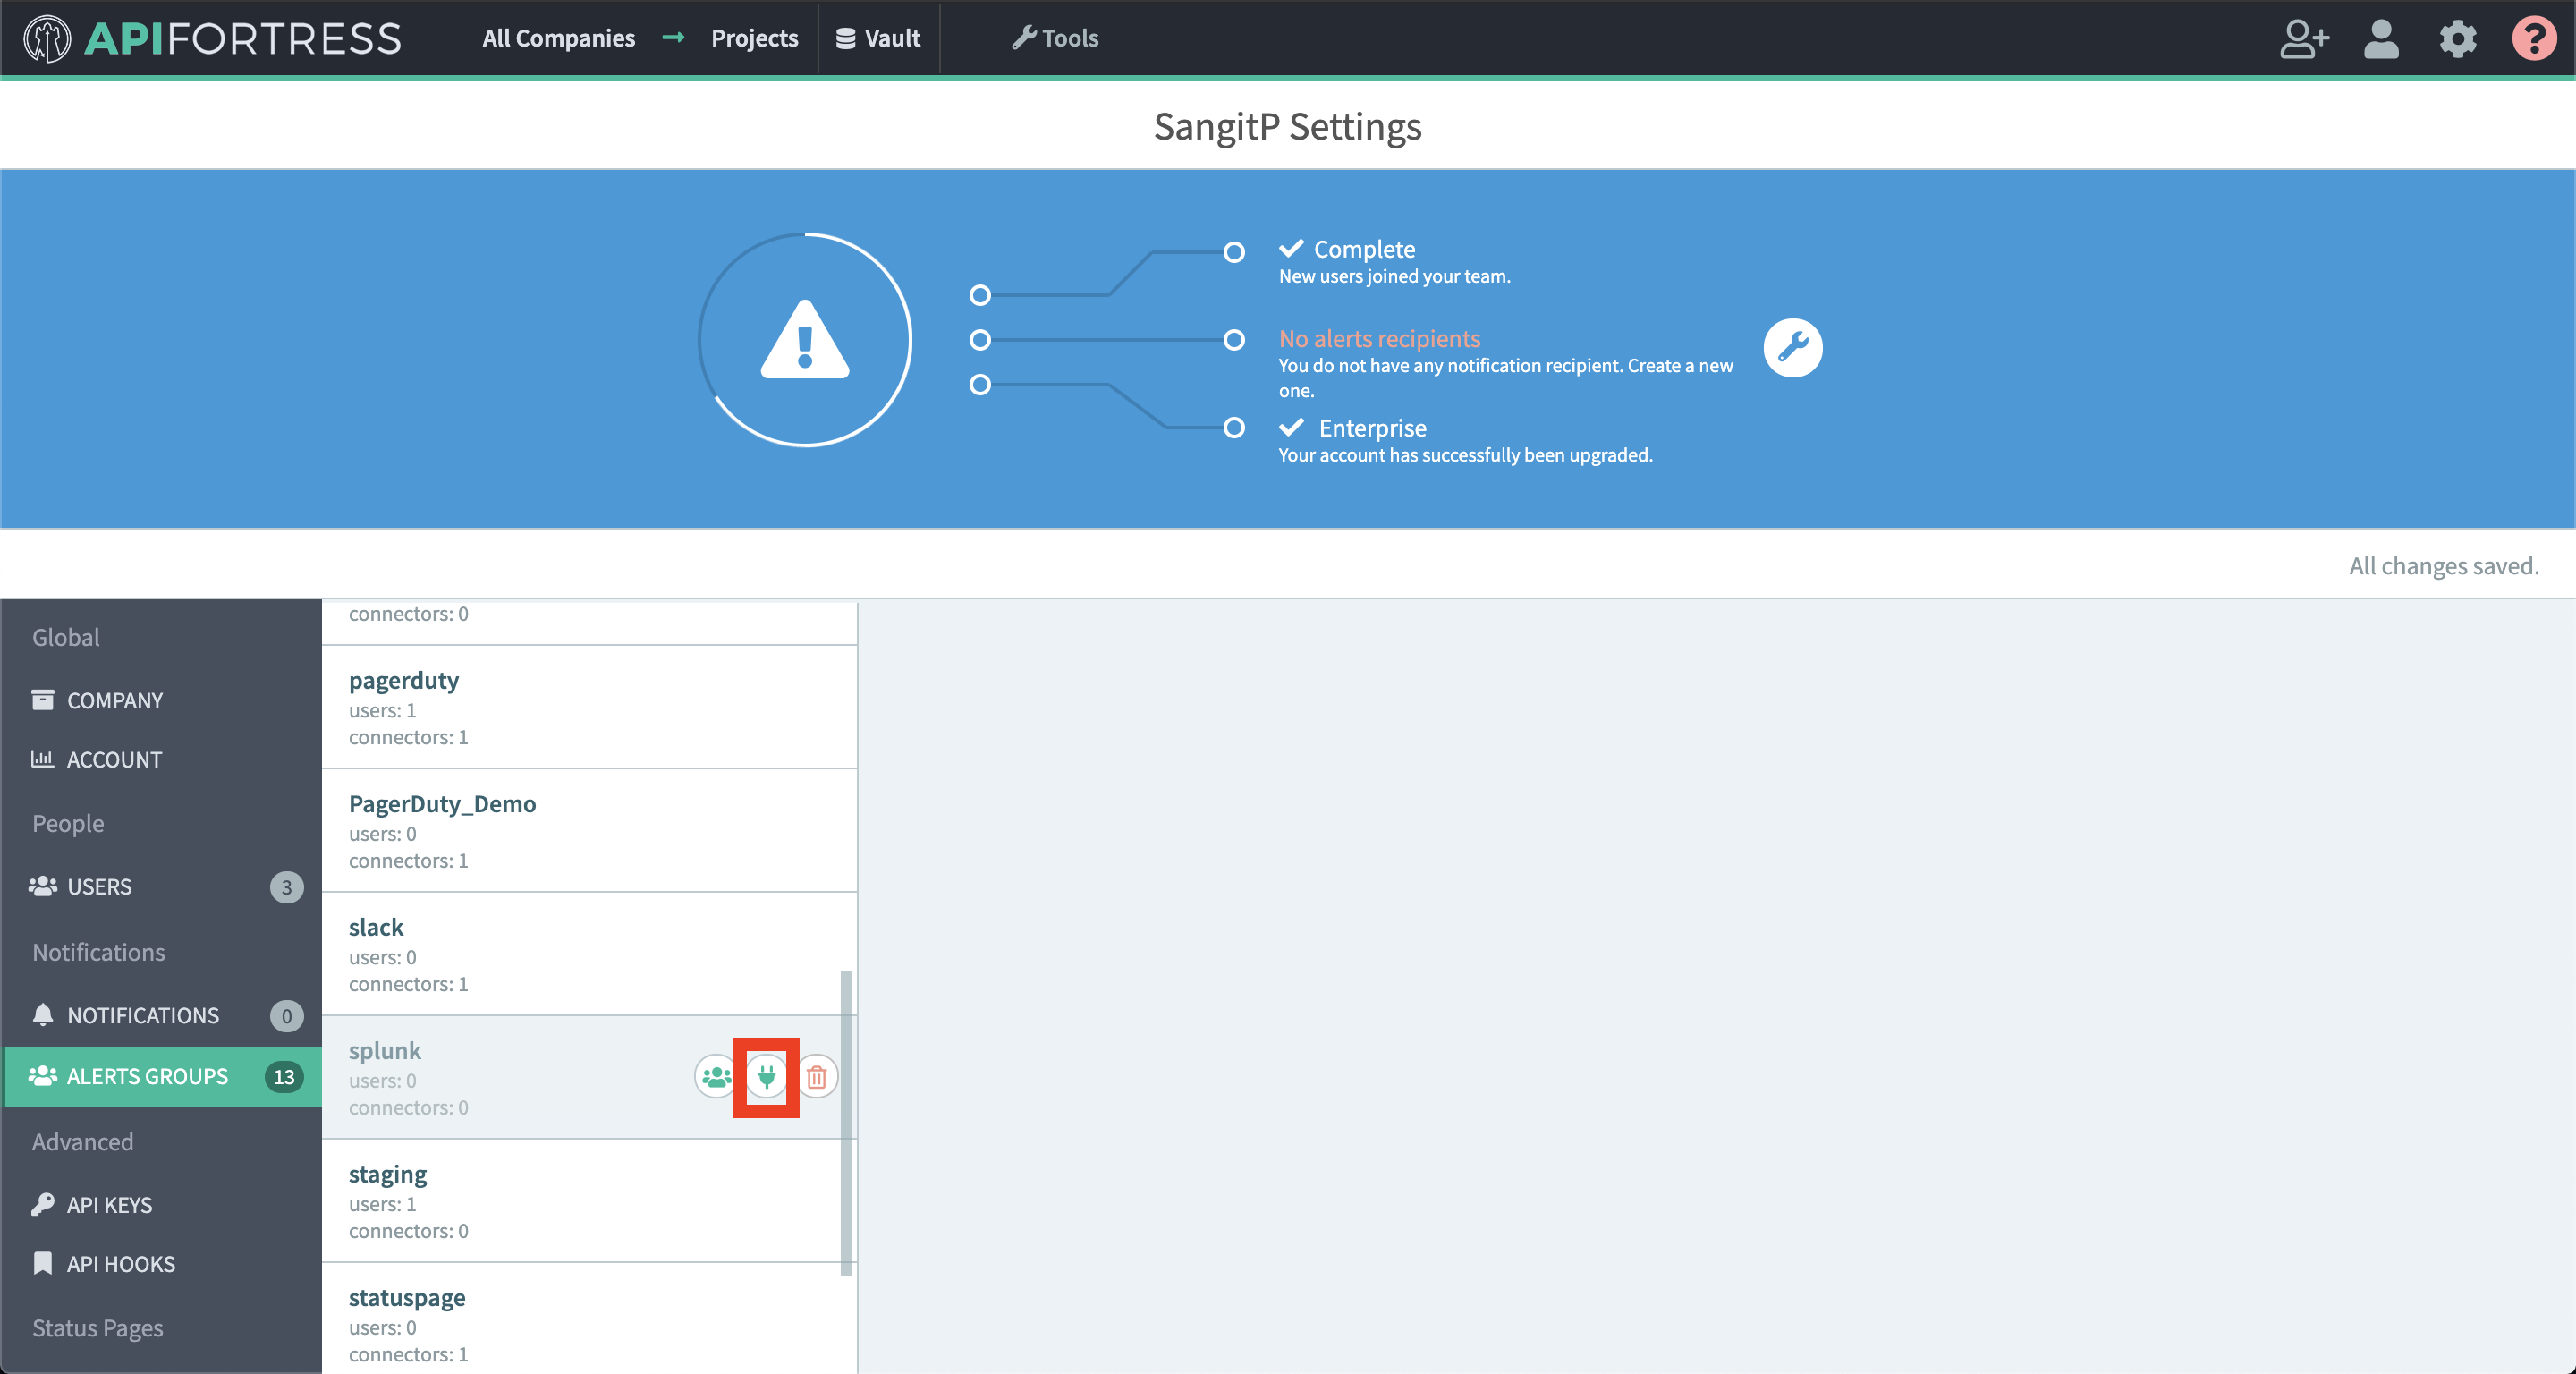
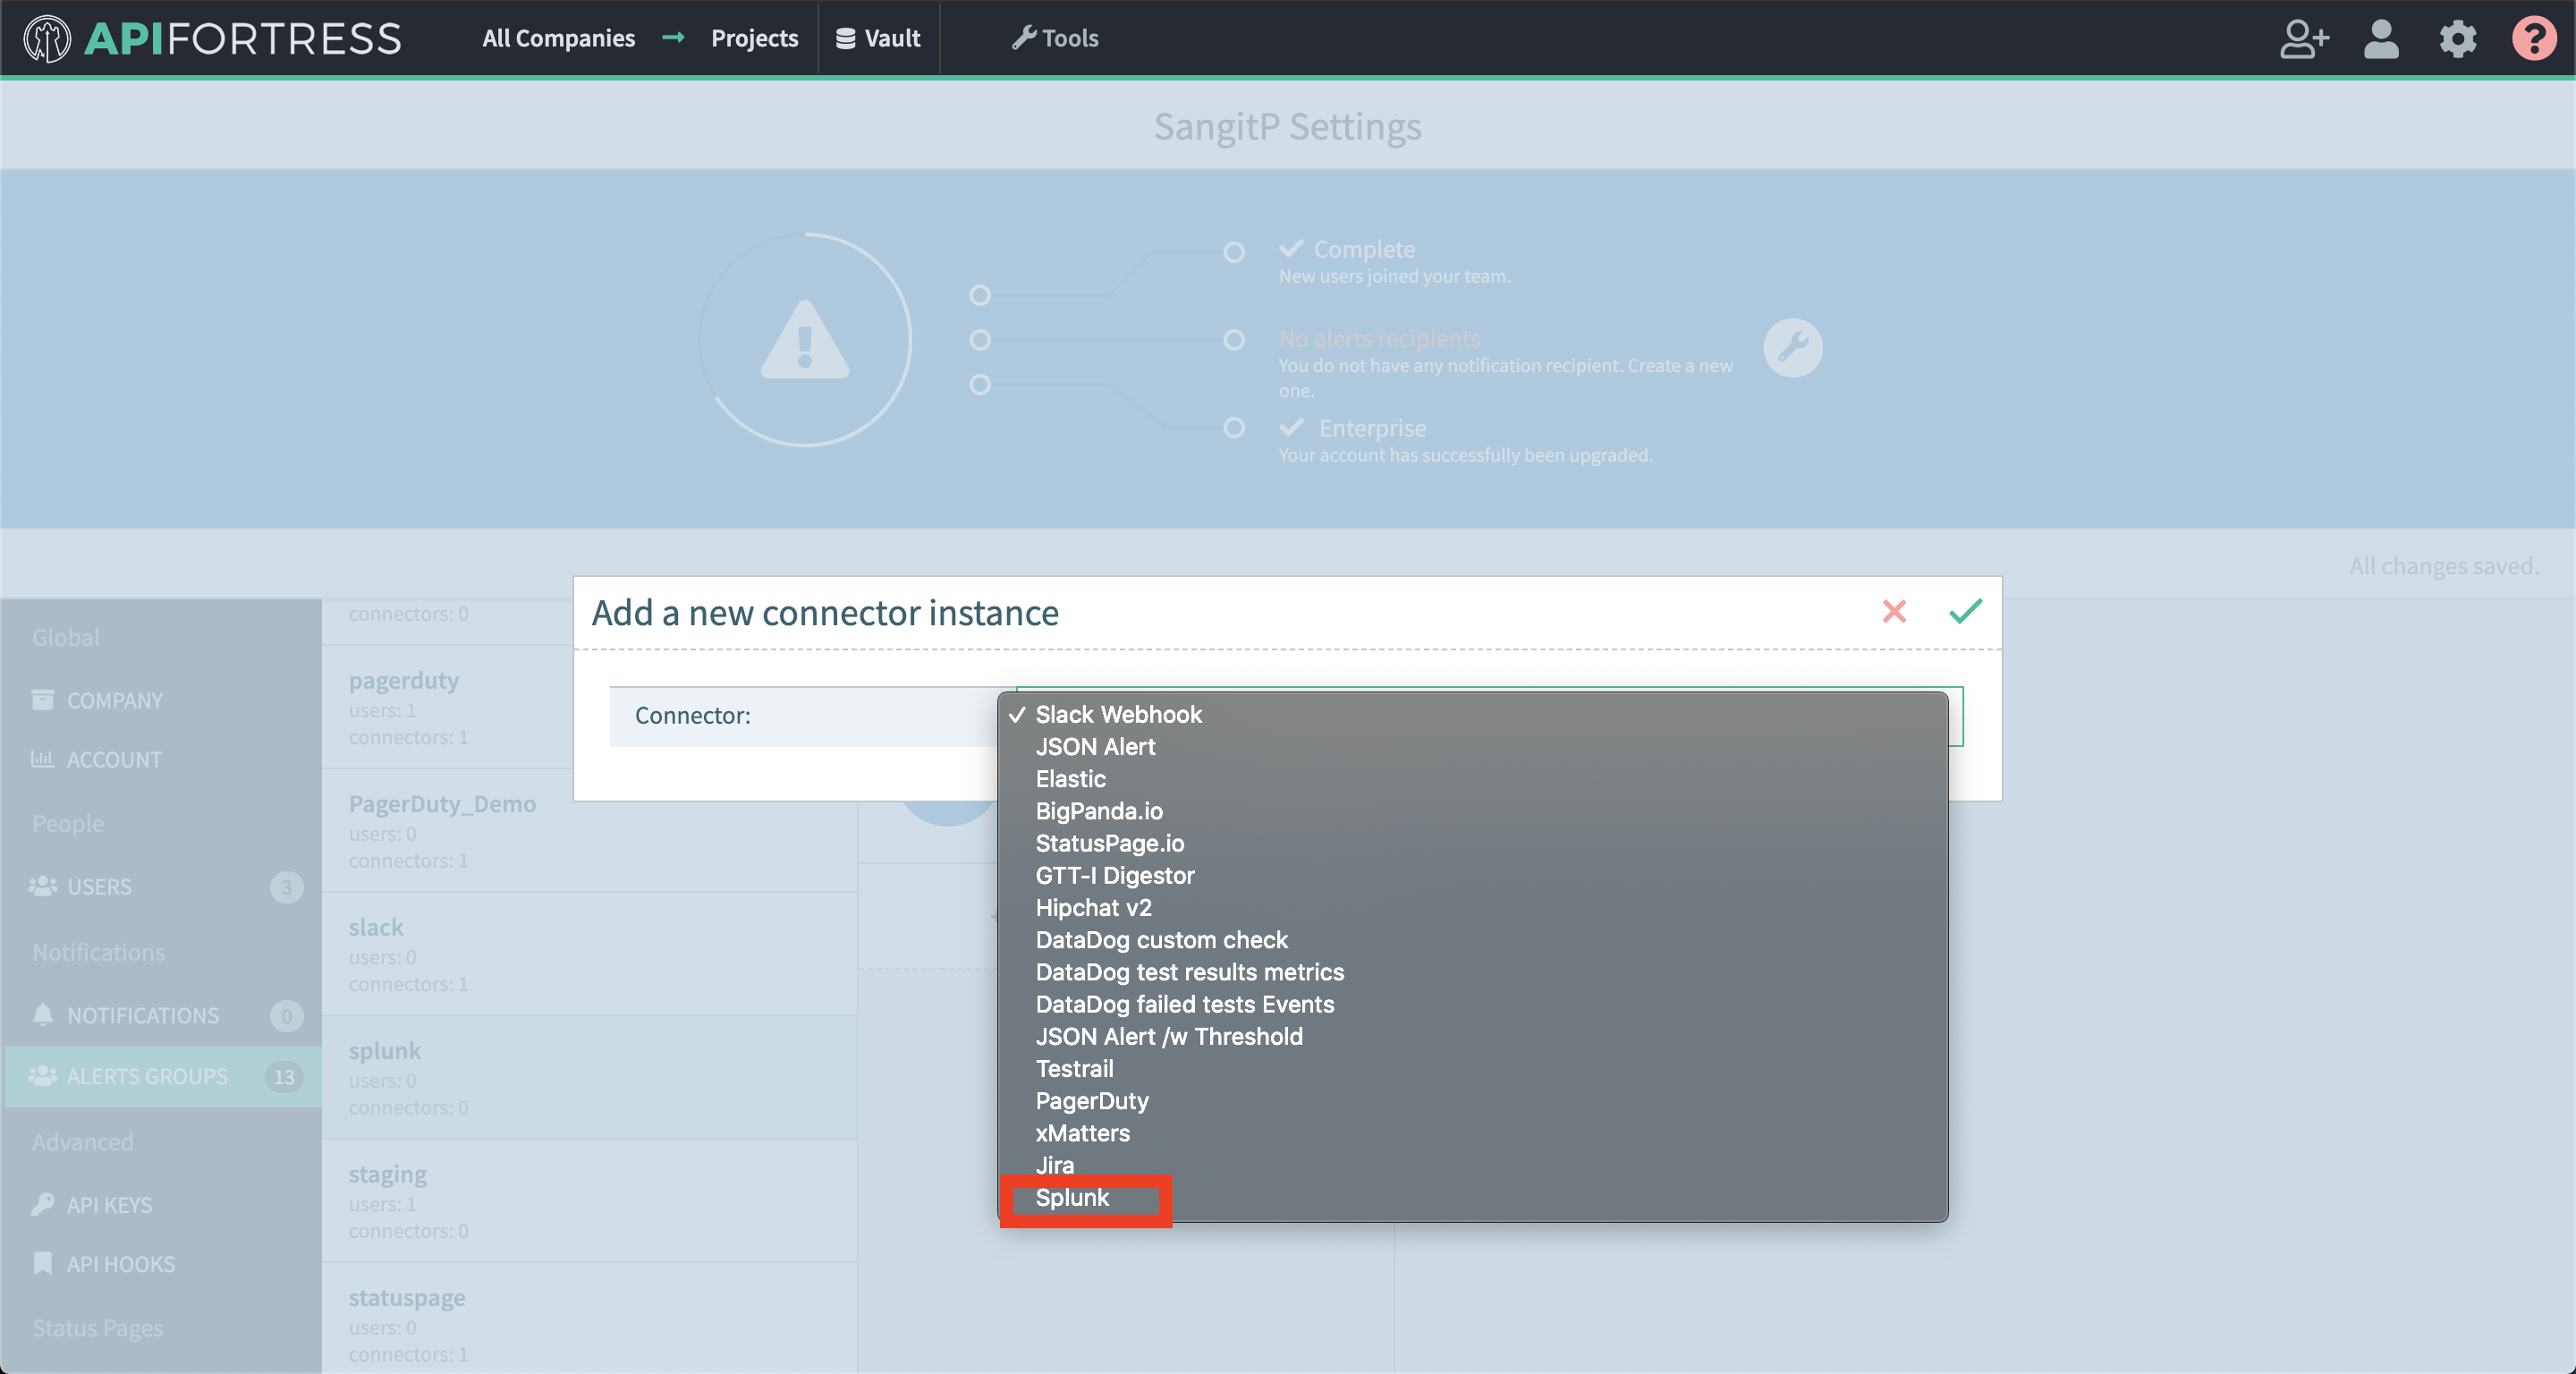
- Add a new connector
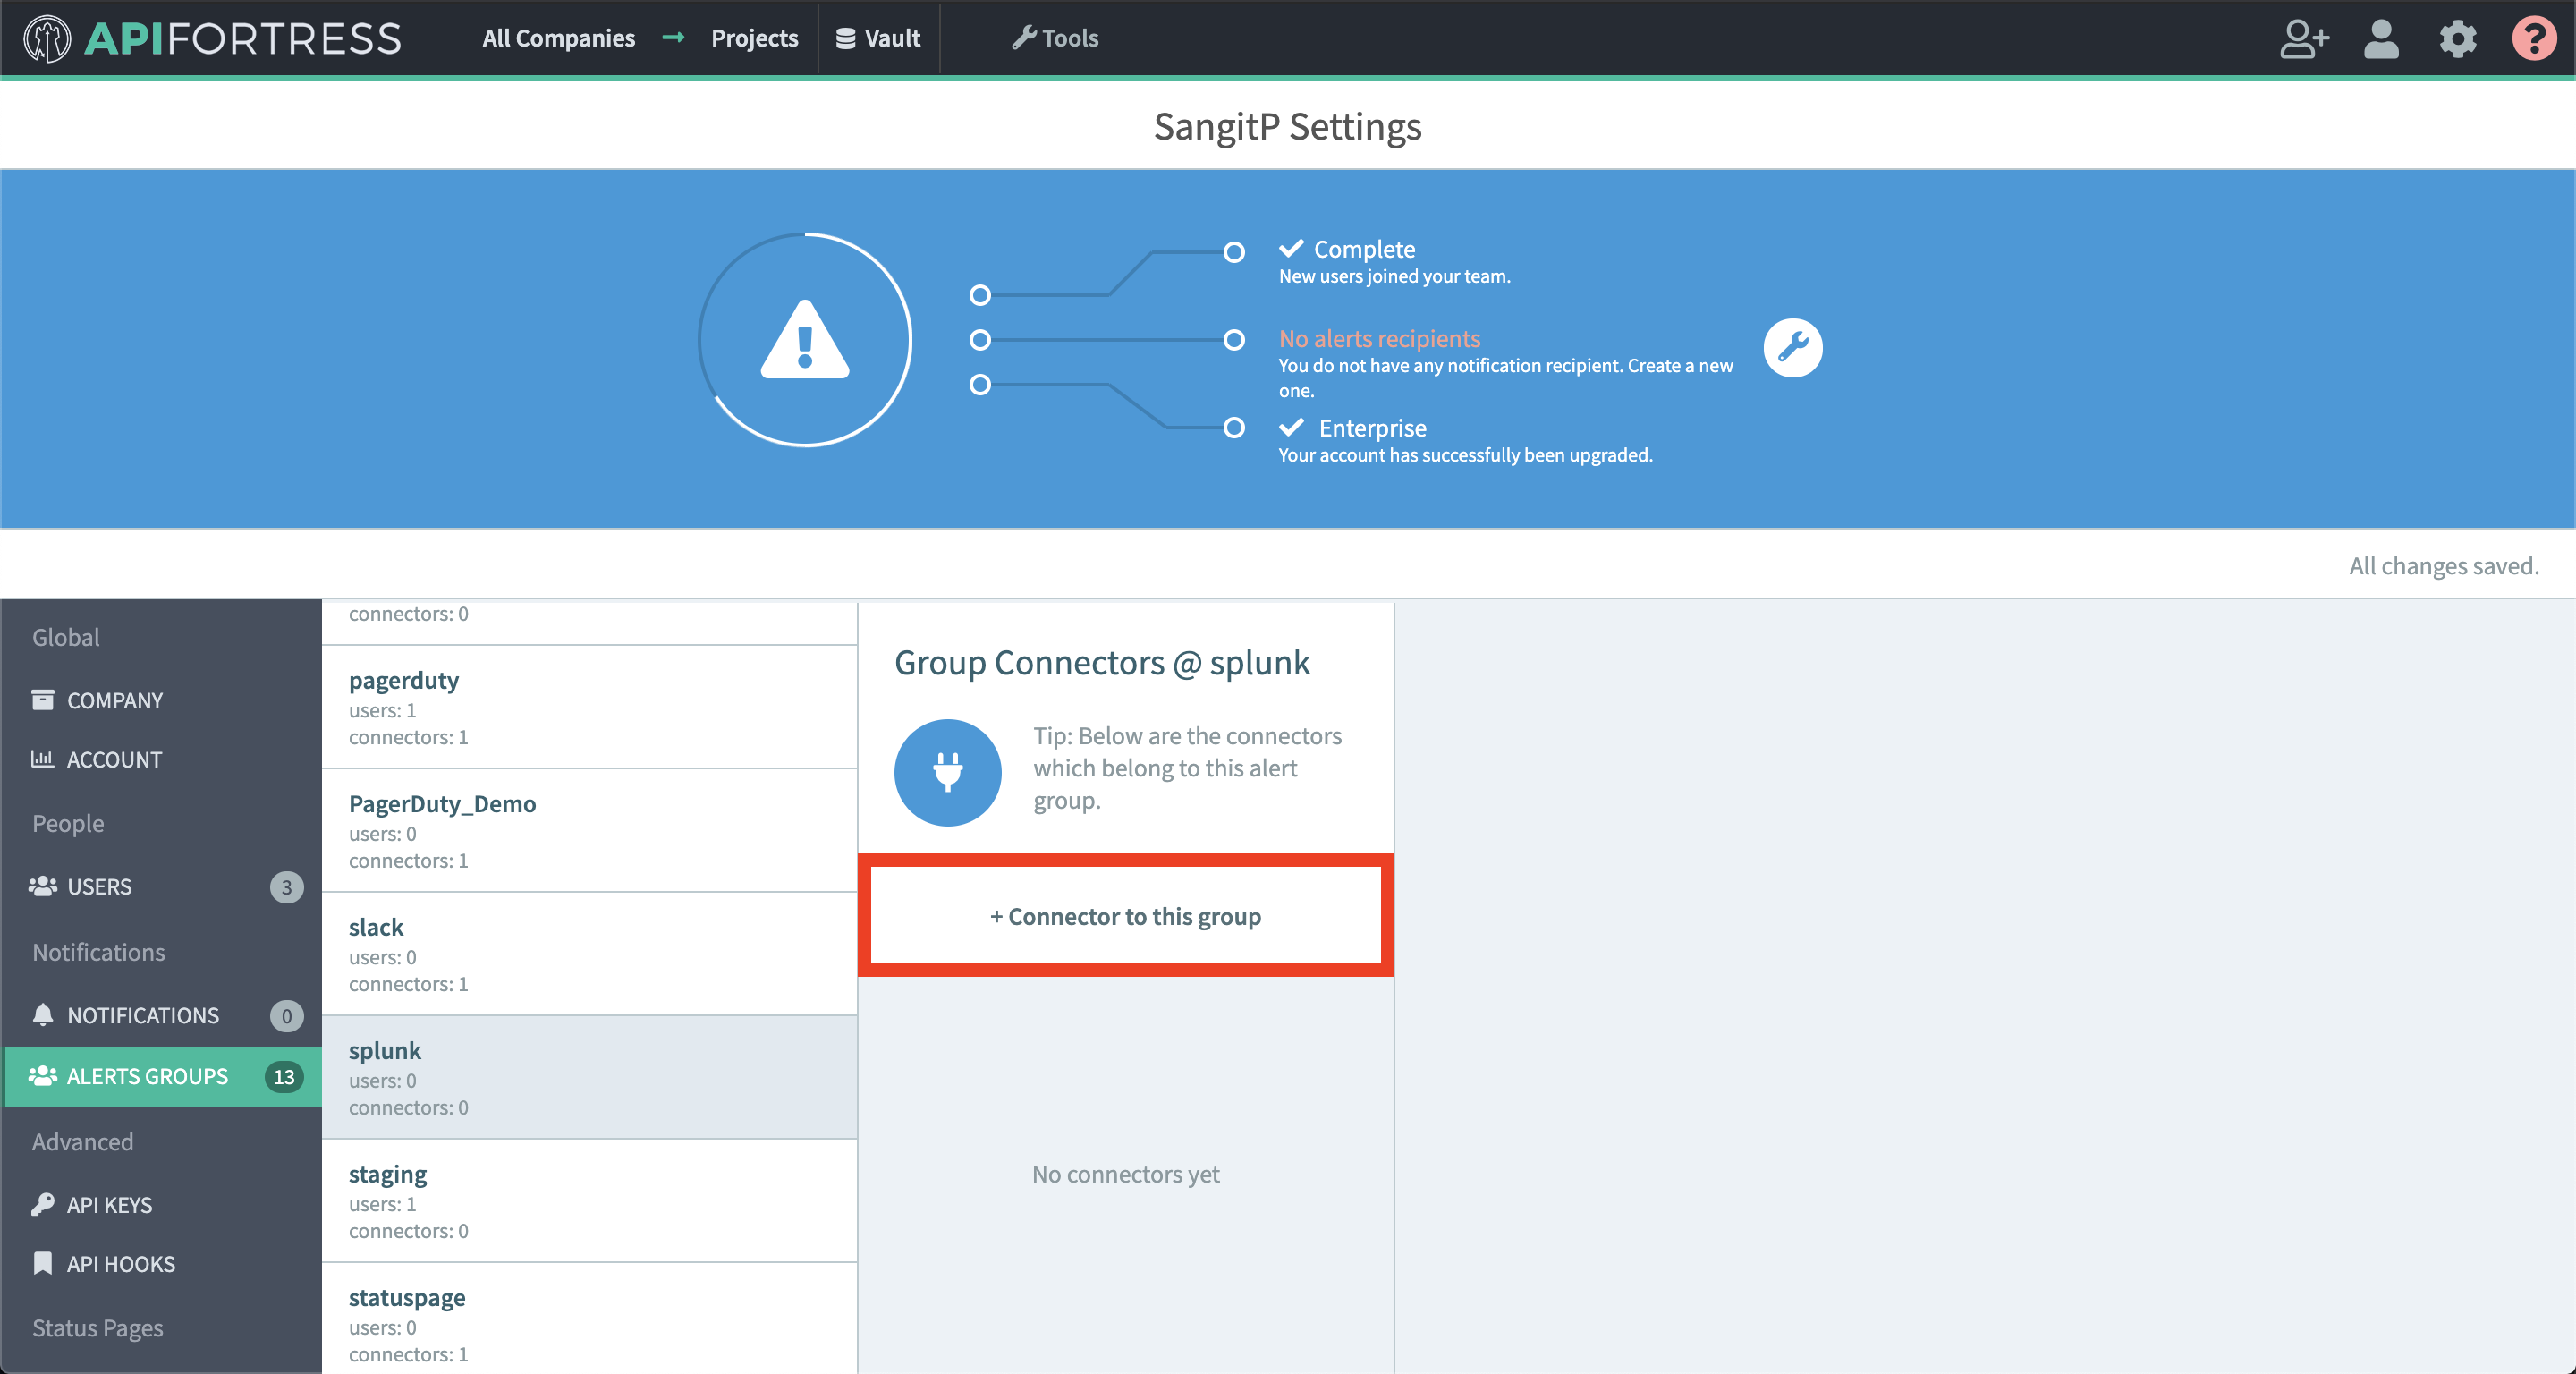
- Choose the Splunk connector
- Configure the connector
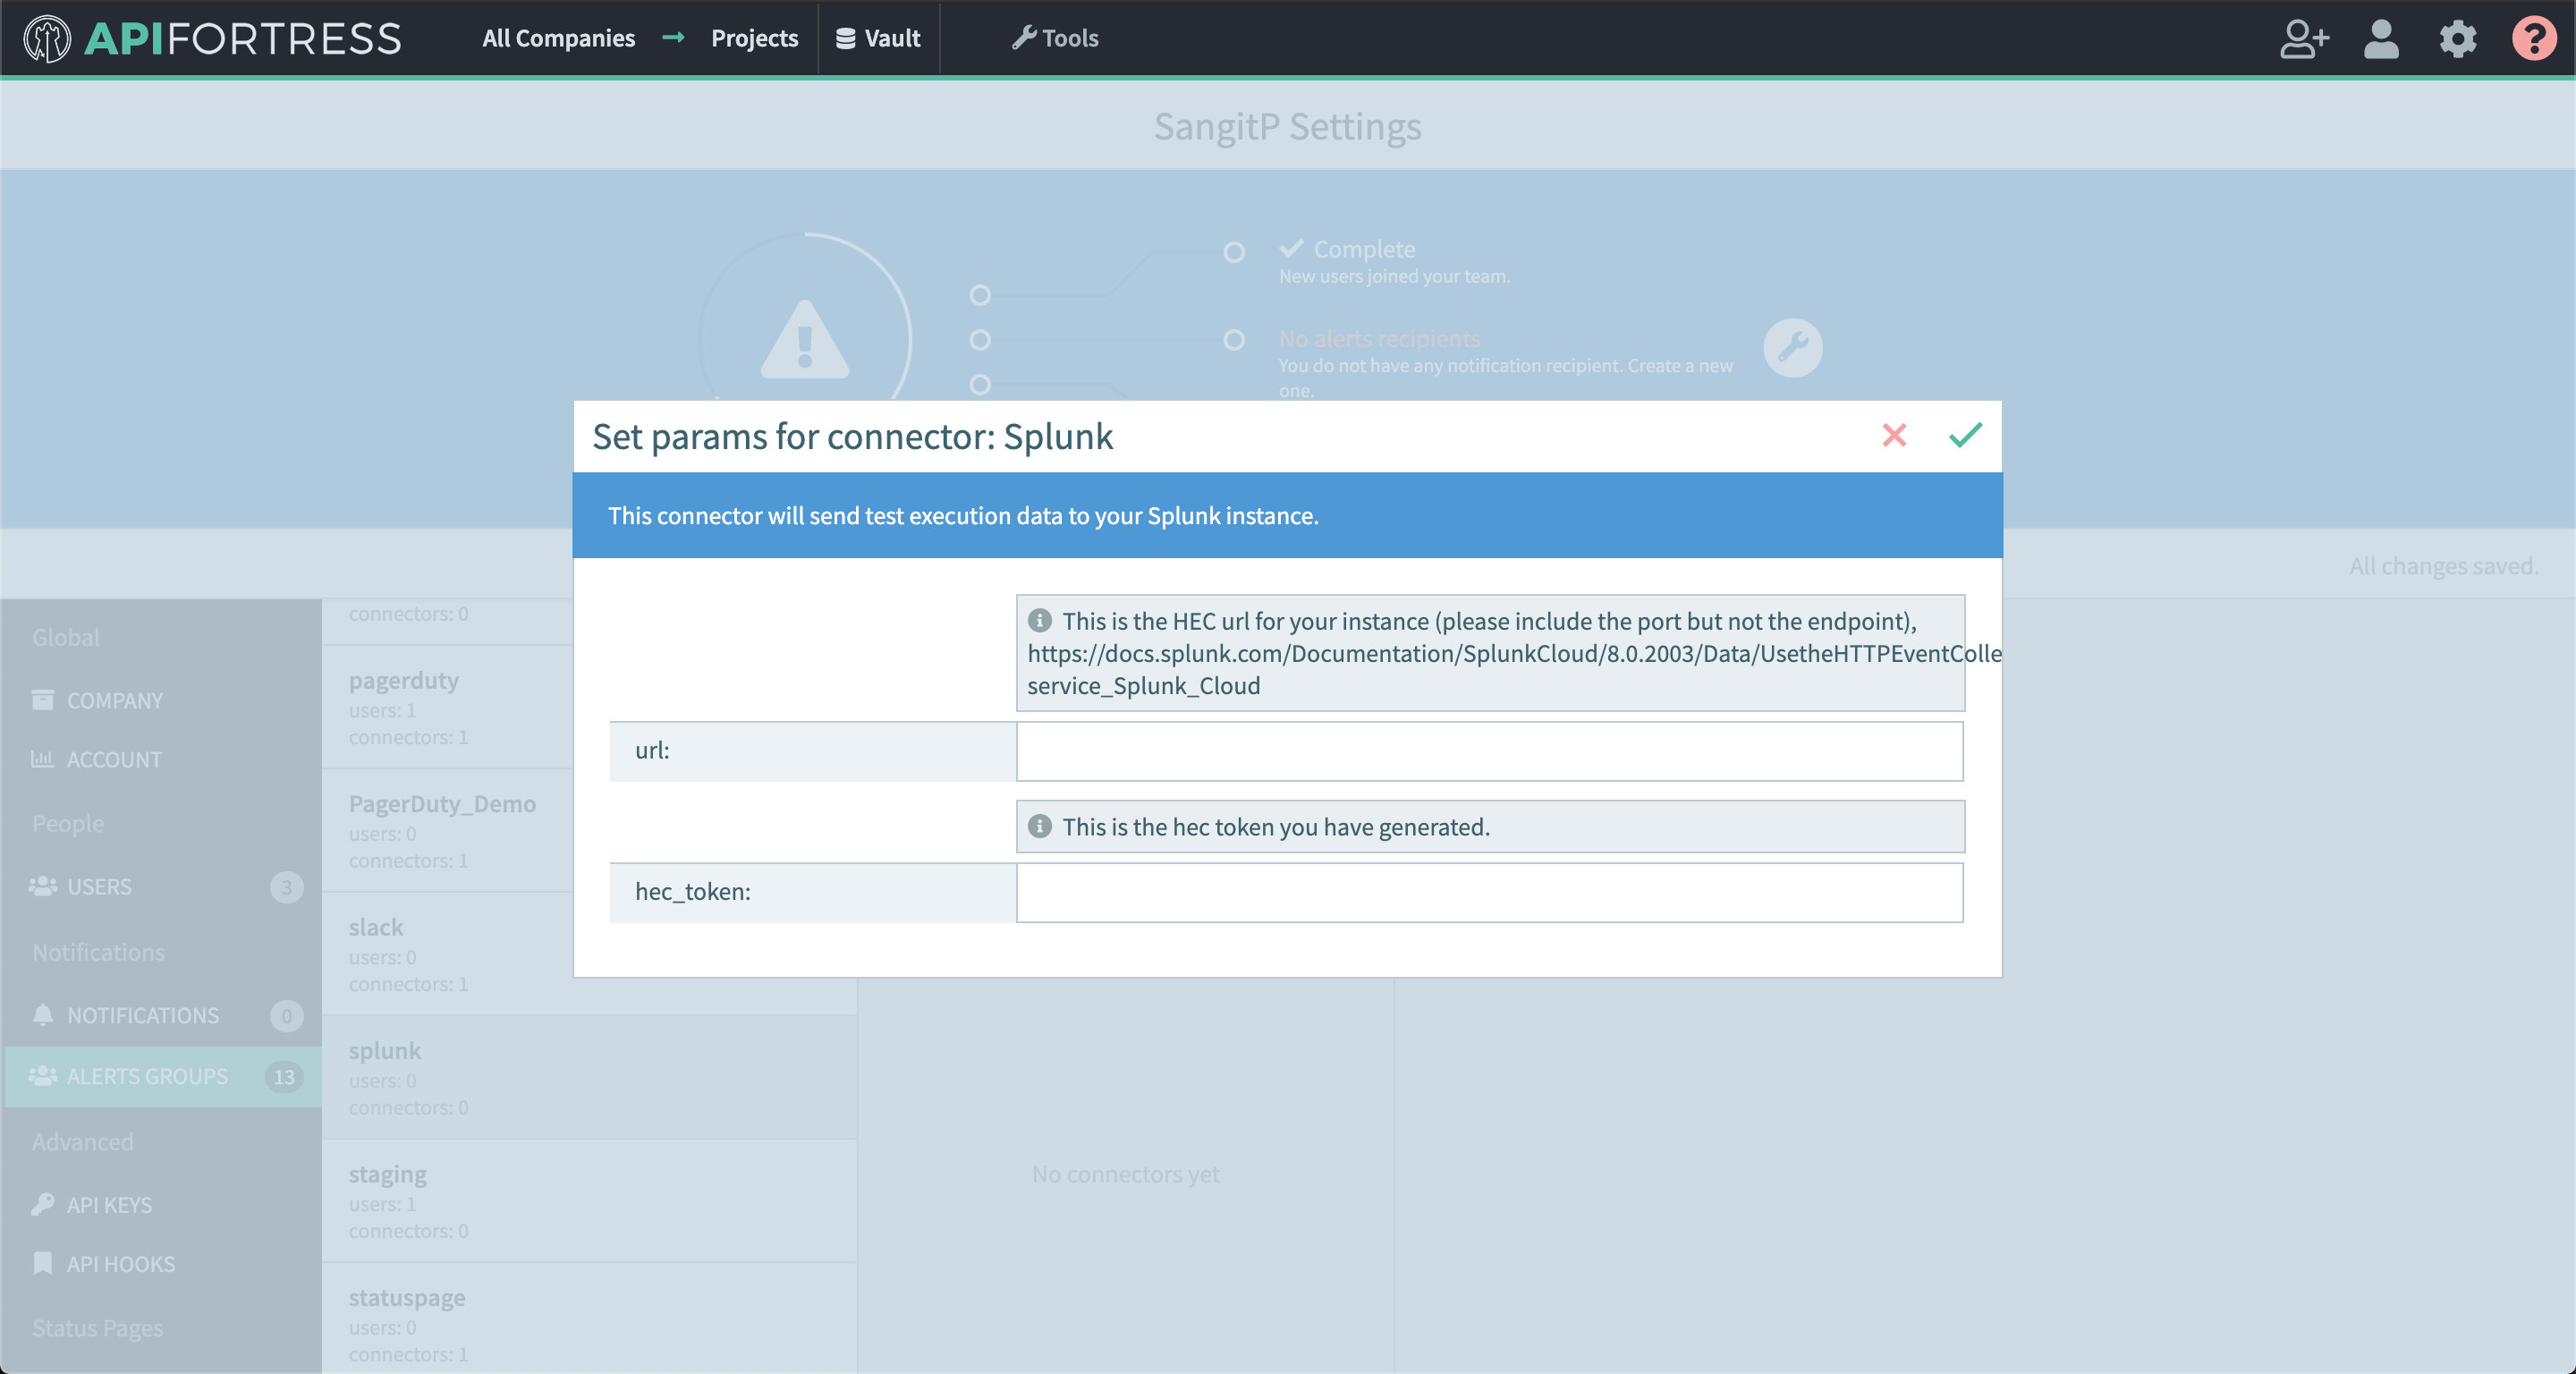
1. url – this is the url for “http event collector” generated in Splunk platform (https://docs.splunk.com/Documentation/SplunkCloud/8.0.2003/Data/UsetheHTTPEventCollector#Configure_HTTP_Event_Collector_on_self-service_Splunk_Cloud). Please include the port number in the url, but do not include the endpoint.
2. hec_token – this is the token generated for the “http event collector” - Go into project settings for a project you would like Splunk connector set up for
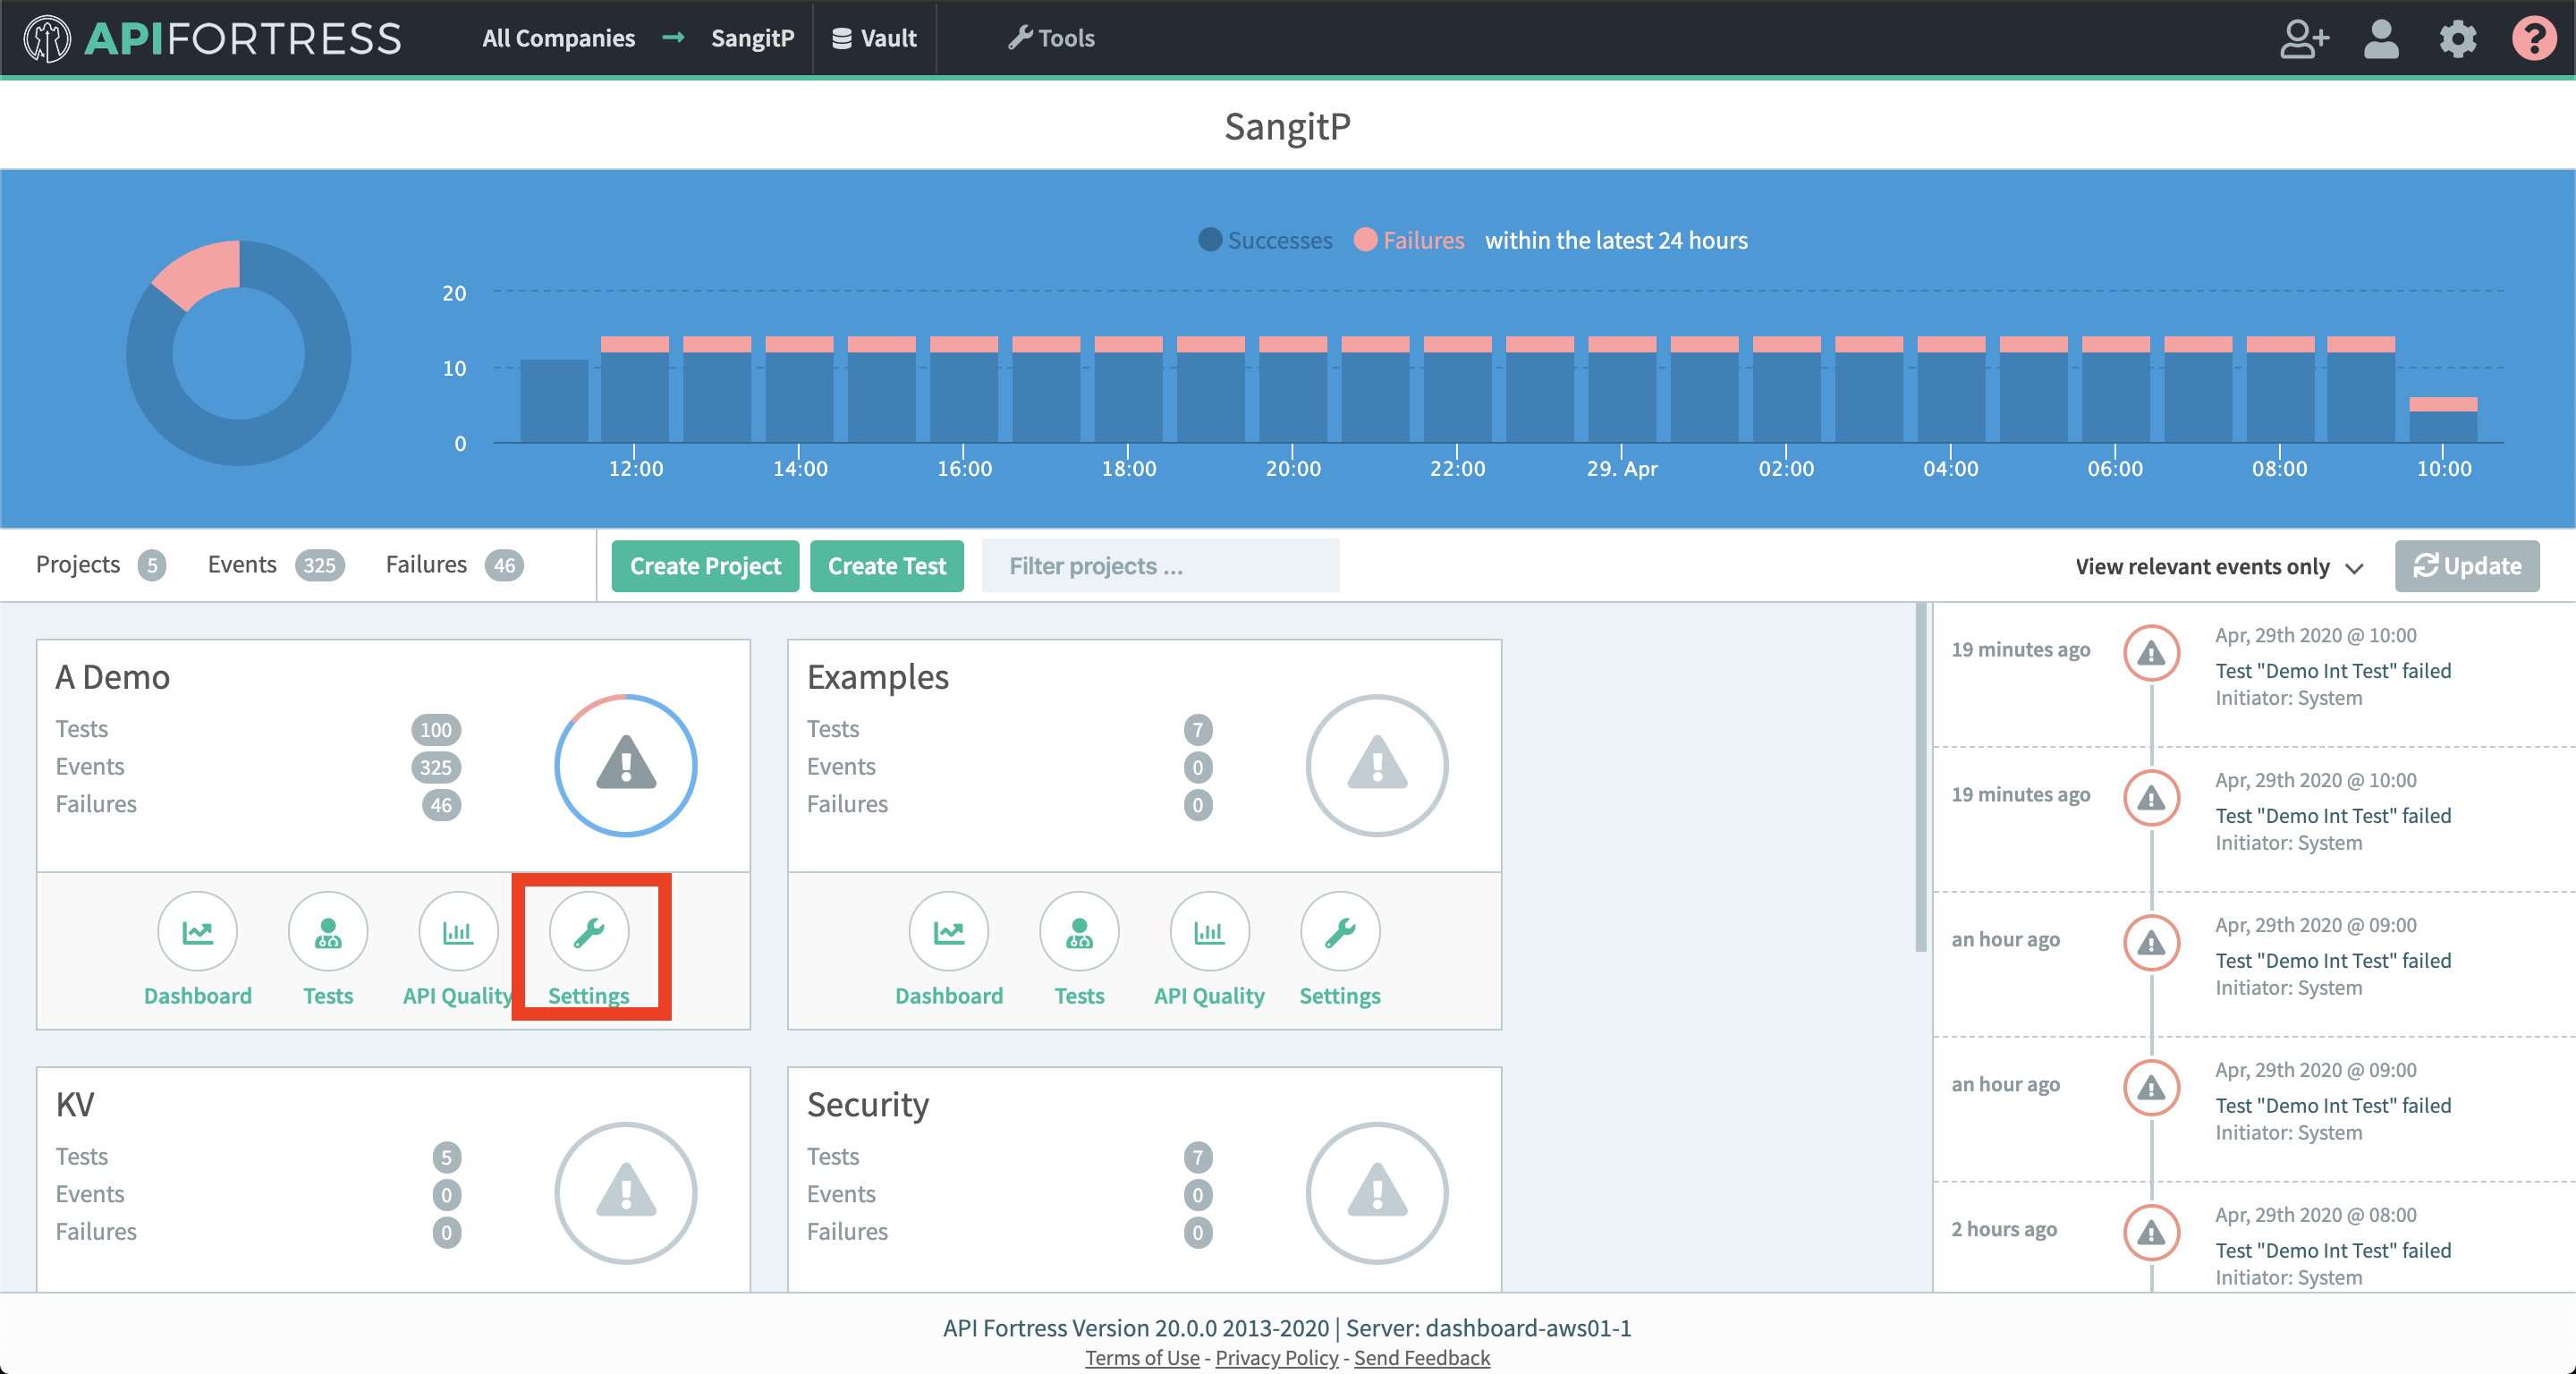
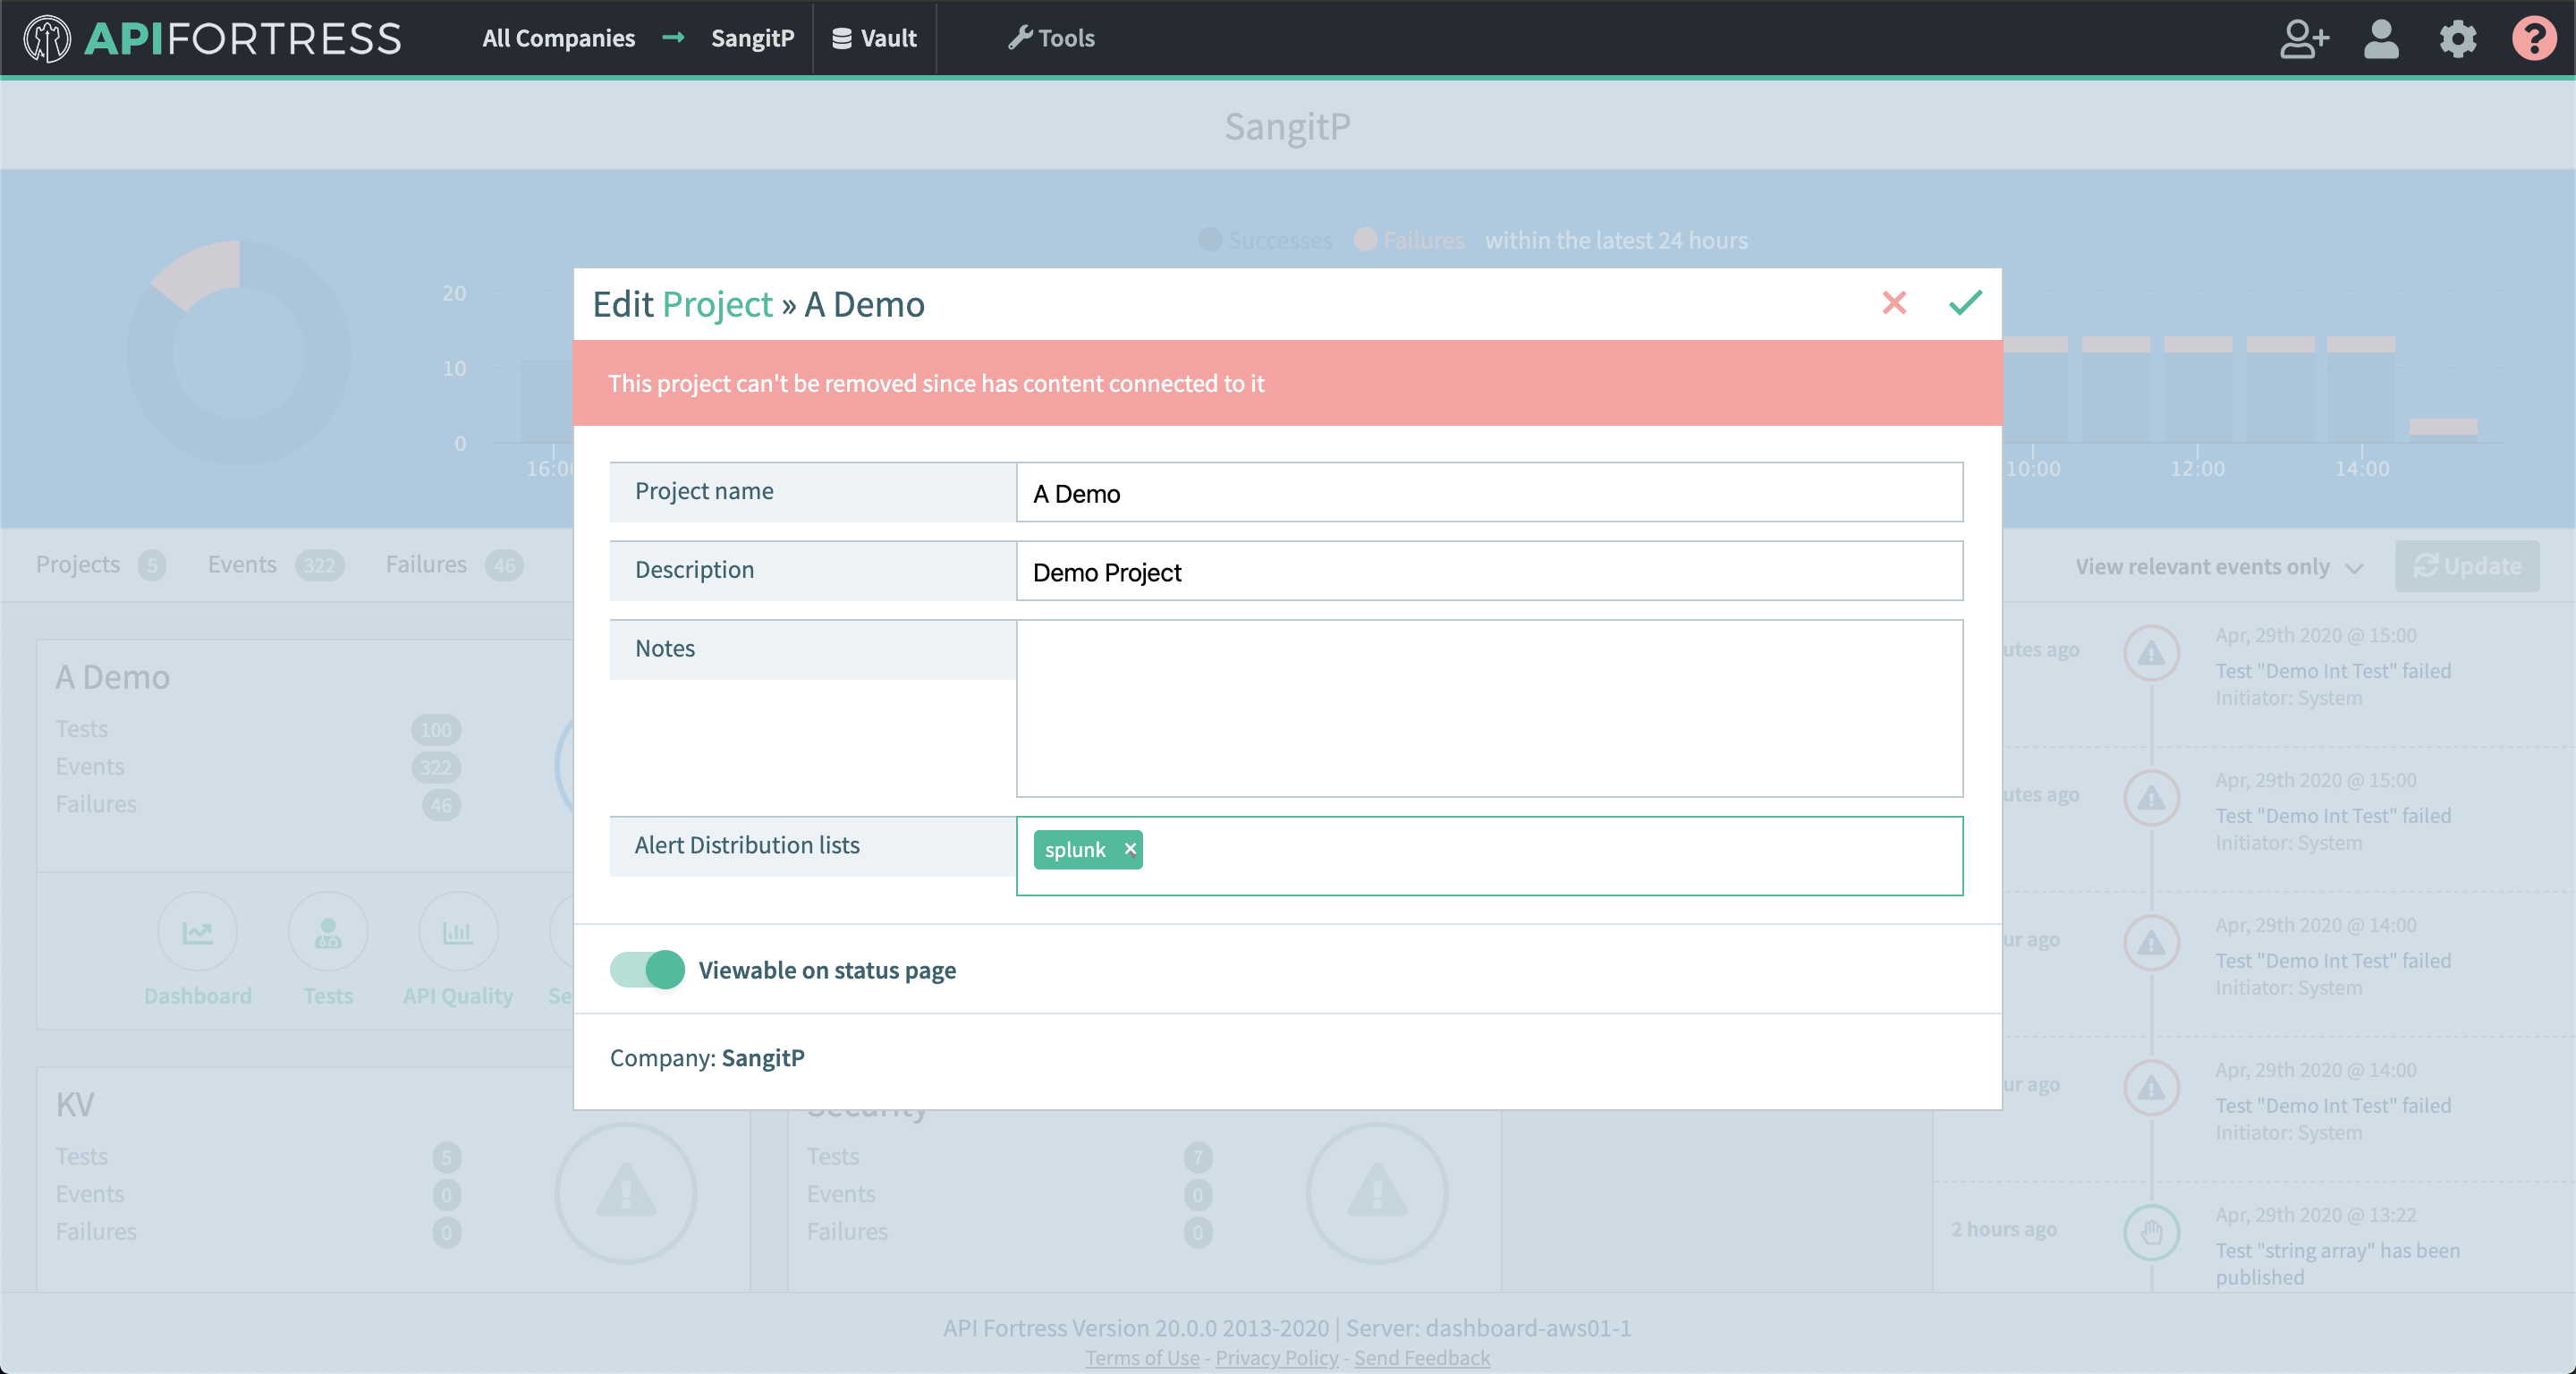
- Add the alert group that contains your Splunk connector to this project
Example Use Case
You can create a dataset table of your executions like so: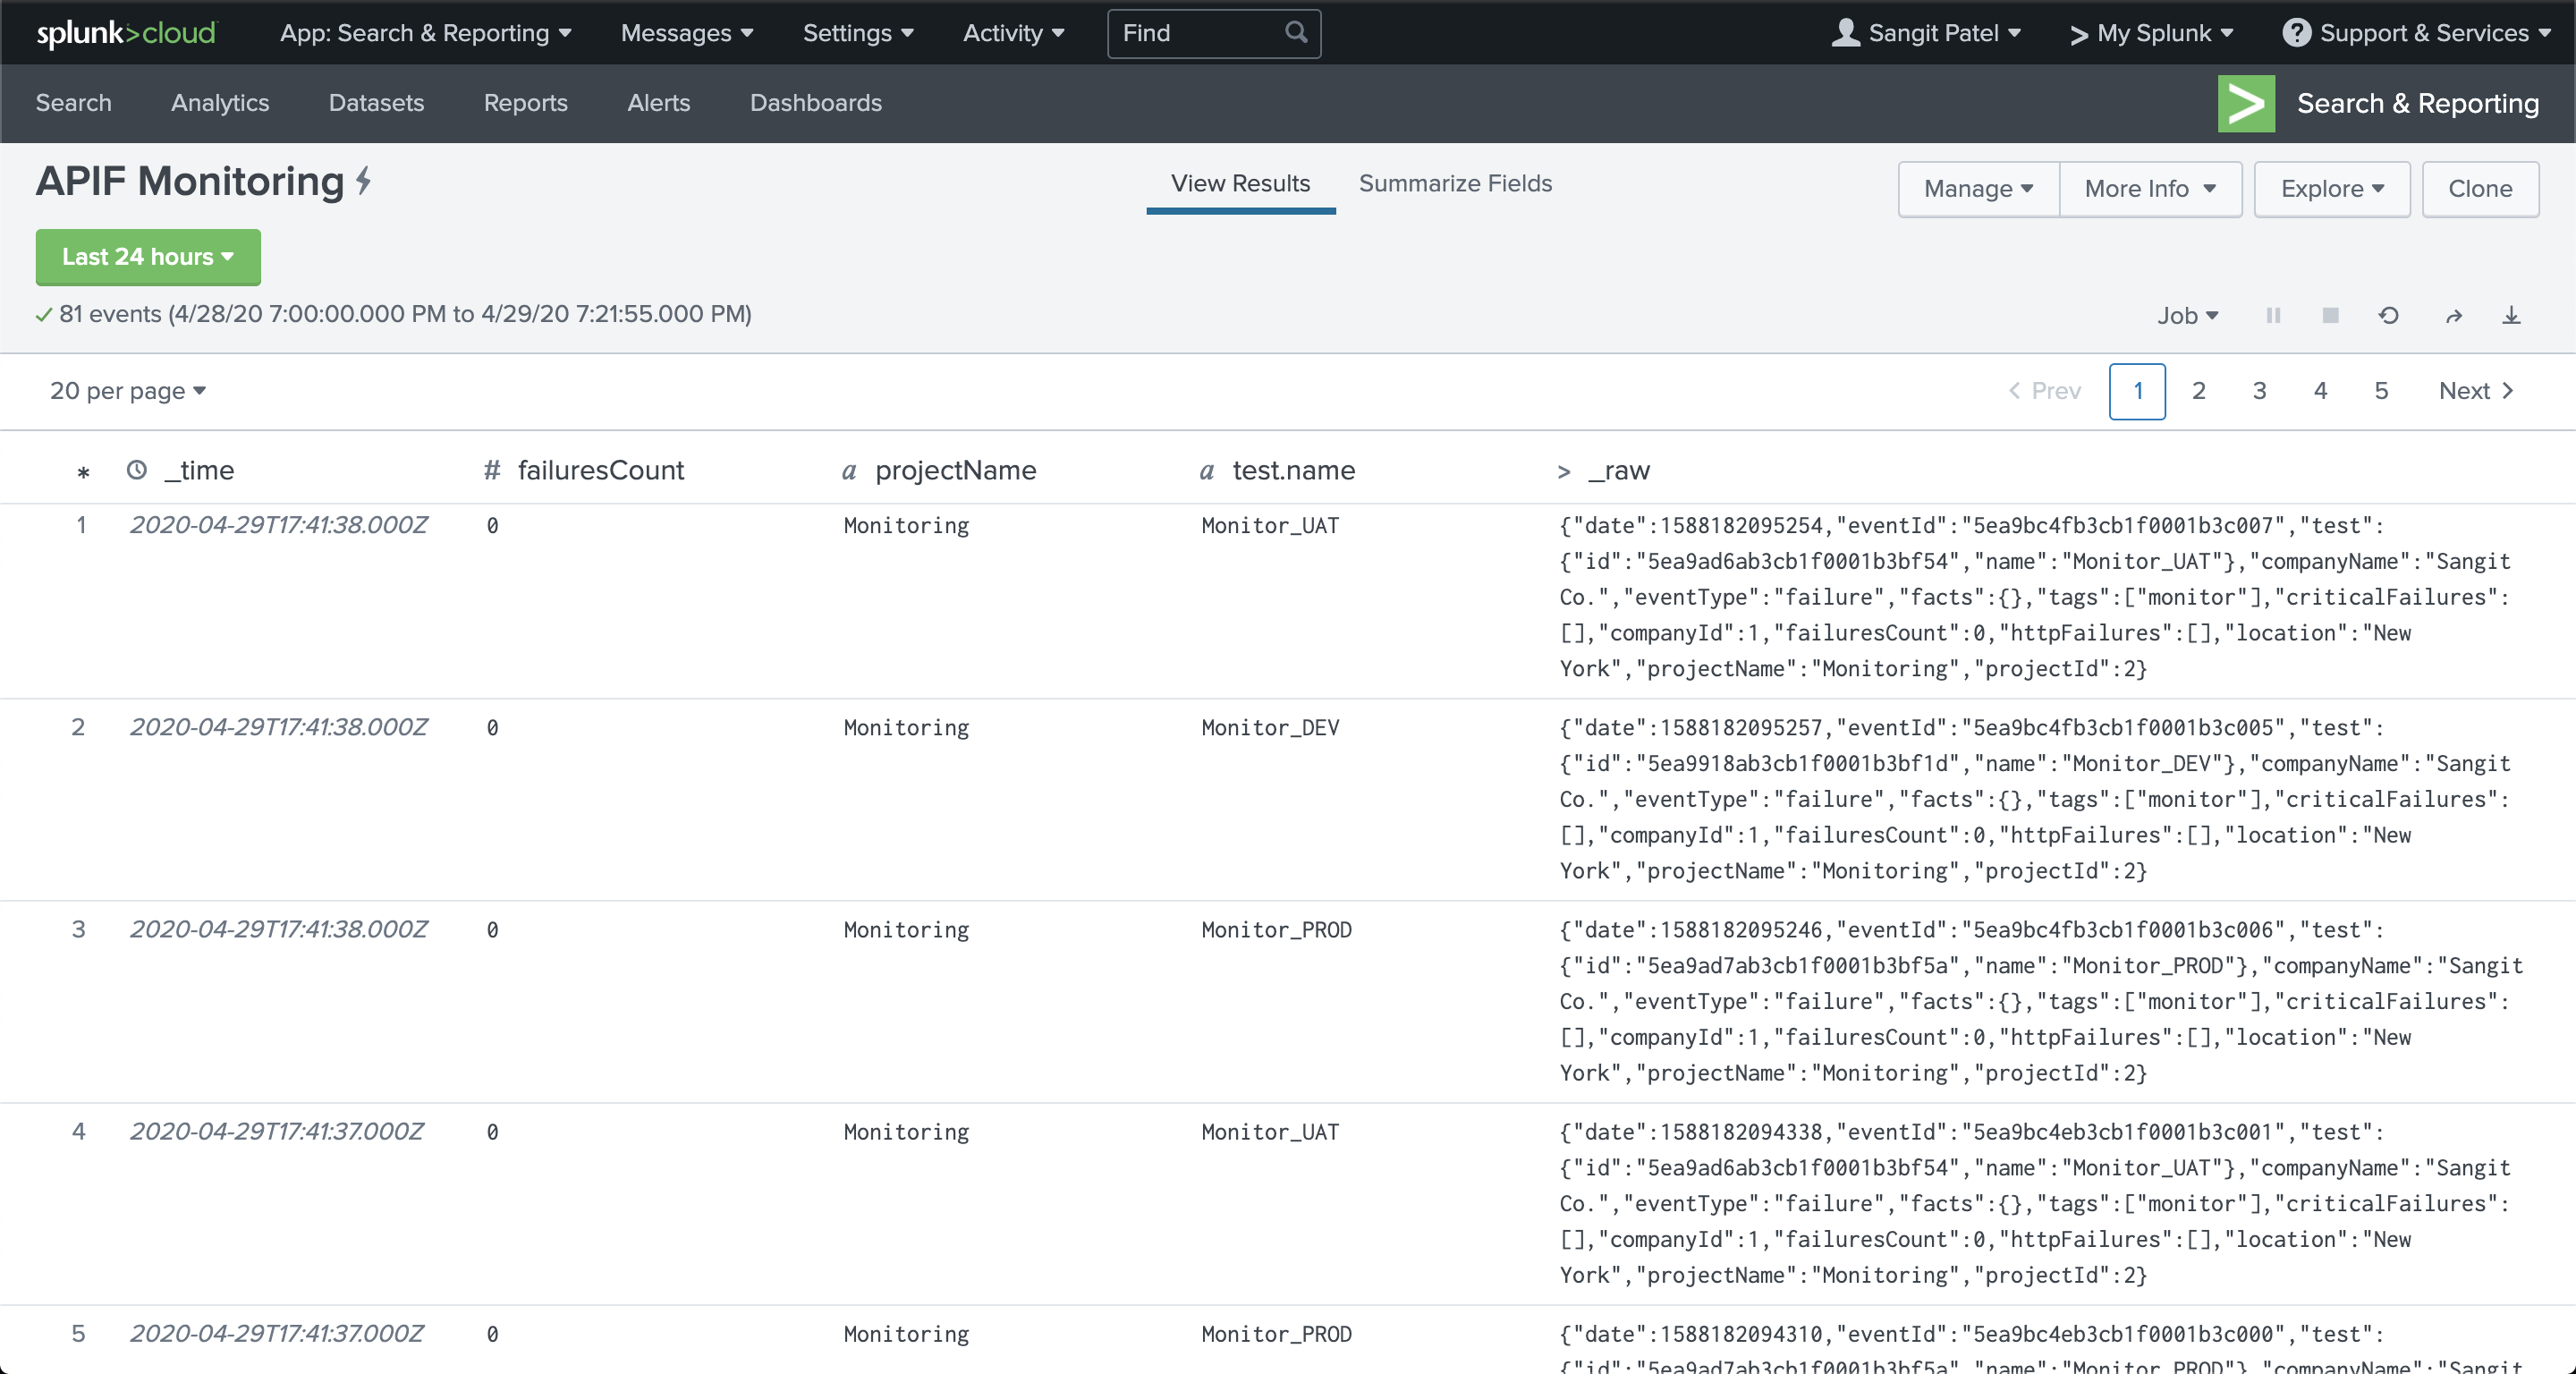
You can also use the data to create visualizations like below: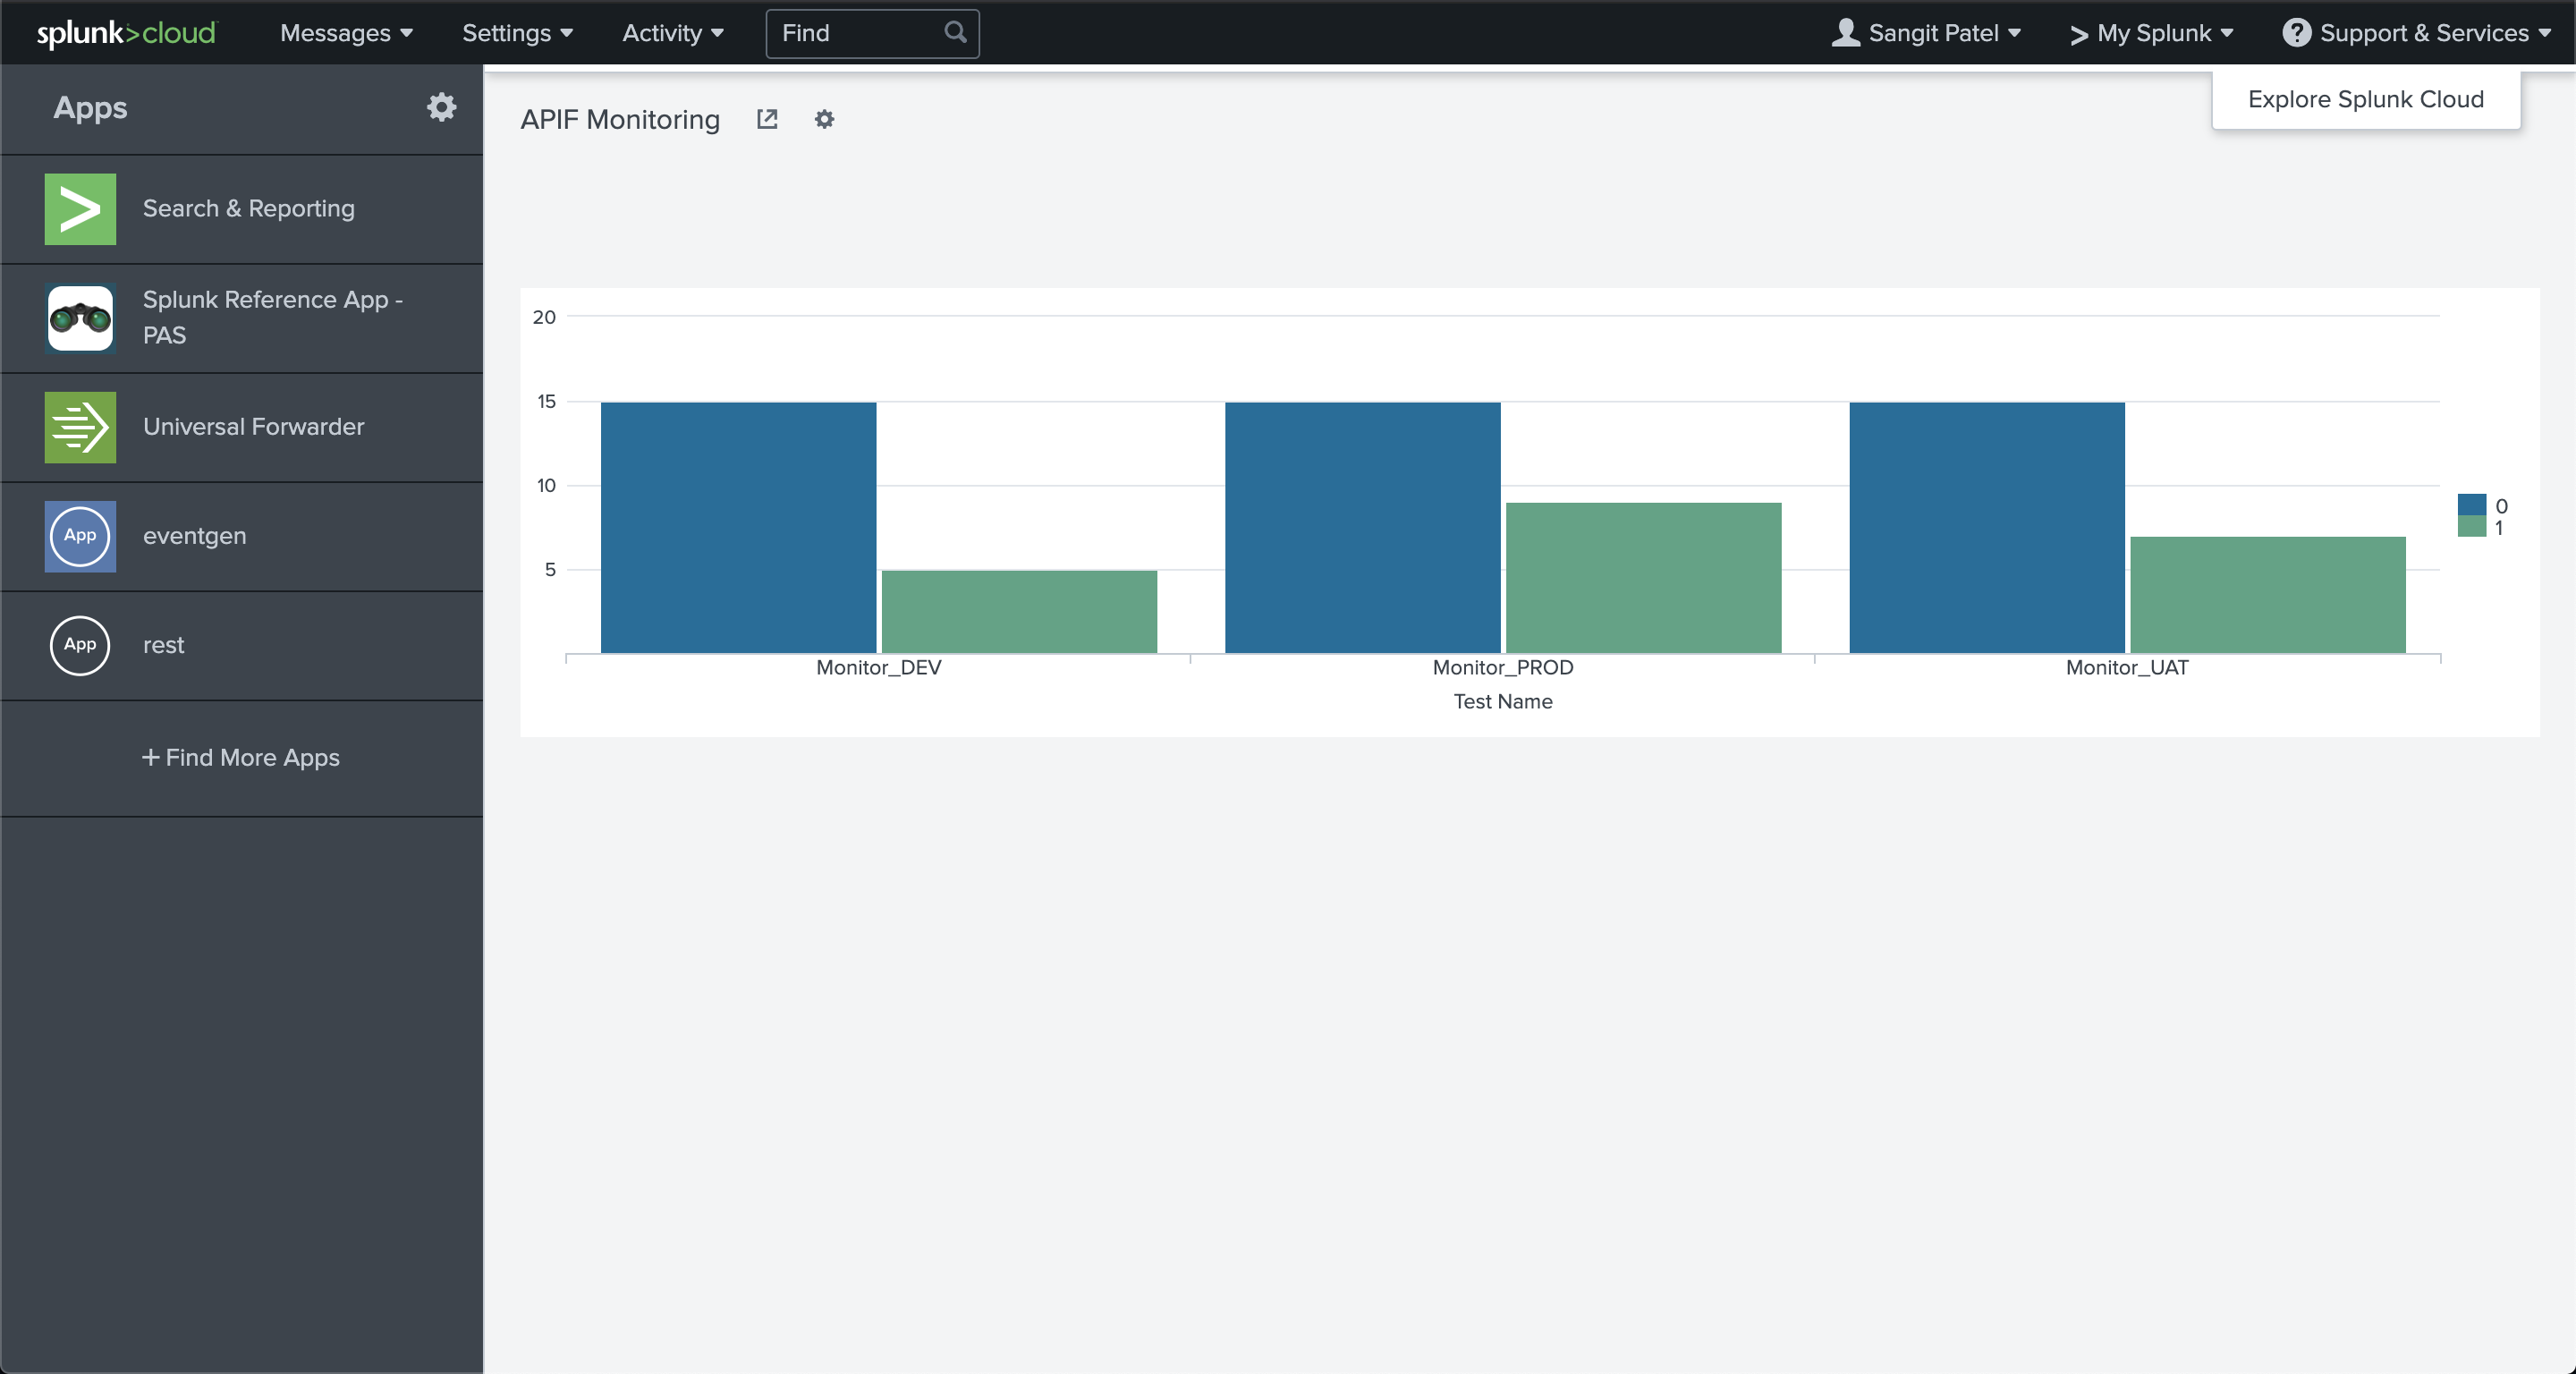
In this example, you can see all the tests executed, and the “blue” bar is the total number of successful runs whereas the “green” bar shows the total number of failed runs.
You can also watch a video walk through of the integration below.