Composer Snippets

A snippet is a fragment of test, stored in the Vault, that can be reused in multiple tests. To create a snippet, click on the first component you want to include in the fragment. Then, hold down the [SHIFT] key and click on the last component you want to include. The selection will be highlighted. Click the + button in the snippets section of the Vault panel, choose if you want to make it available only for the current project or for all the projects in the company and fill the Name and Description fields. That is it! The fragment of the code is created and ready to be use in every test of the project. For each snippet, two actions are available: 1) Paste Snippet: Allows you to paste the entire component inside the test, allowing you to edit as needed. The pasted components will lose any reference to the original snippet. 2) Invoke Snippet: This creates a Call component that will invoke the snippet. If the snippet changes, all the tests containing the Call component to that snippet will inherit the changes.

Tag

This component is used to dynamically tag the resulting document of a test execution. You can easily find a document by searching for the specific tag, in the same way you can find a test by searching for the tag you assigned to it. In the composer you will have the ‘tag’ component as option to be added. In this way, you can add different tags based on dynamic events happening during the test execution, such as a certain value retrieved in the payload. You can assign multiple tags to each test by adding more ‘tag’ components to it. Parameters:

Name

Type/Value

Required

Value String

Yes

Another way to add a tag to your test is in the test details screen during test definition or edit. tag Static tags will be displayed in the tests list. All tags, dynamic and static will mark the test execution documents. In the project dashboard, you have the ability to filter events by tags. There is also a dedicated API that does the same. For more info please see the documentation here

Company settings

The Company settings page allows the manager(s) of a company to alter global settings such as  the users that can access the company, who will receive the notifications etc. 
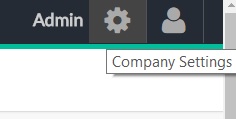
The page can be reached by clicking on the top right icon (gear). The page is composed by different sections: Company, Account, Users, Notifications, Alerts Group, API Keys, API Hooks, Big Screen, Shareable. In the 
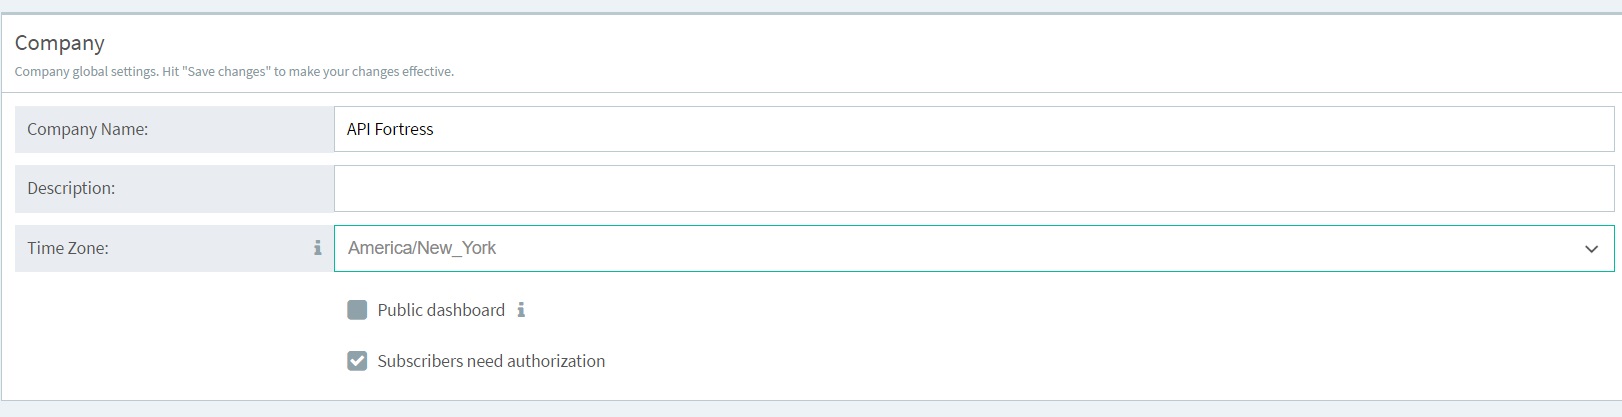
Company page, you can set the Company Name, the Description and the Time Zone. The Time Zone is important because it will be used when you schedule a test: if you schedule a test at 9am and Time Zone is ‘America/New York’, test will run at 9am New York time, that is different from 9am ‘Europe/London’. At the top of the page, the ‘Save changes‘ button will make your changes effective. In the Account page, you can see information about the company:   Contract: the contract type of your account. Monthly Events: the number of executions so far for the current month. Monthly API Downloads: how many times tests downloaded a web service. Overall documents: the number of documents generated and still available for consultation. The Users page allows you to add and remove users to the company account.
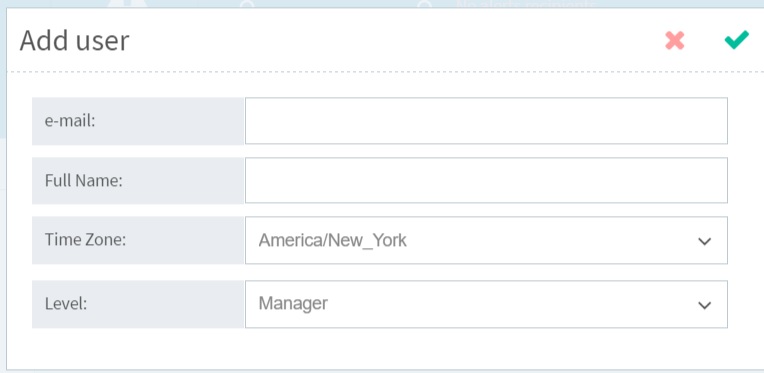
 By clicking ‘+ User‘ you will be presented a popup: e-mail: the email address of the user you want to add. Full Name: the name of the user. Time Zone: the Time Zone of the user. Level: the permission level of the user: as ‘Manager’ the user will have access to company settings, tests and analytics. As ‘Developer’ the user will have access to tests and analytics. As ‘analyst’ only analytics will be made available. In the Notification page, you can add and administer who receives alerts and reports. You can add either an user that has access to the company or an user that does not have access to the company.
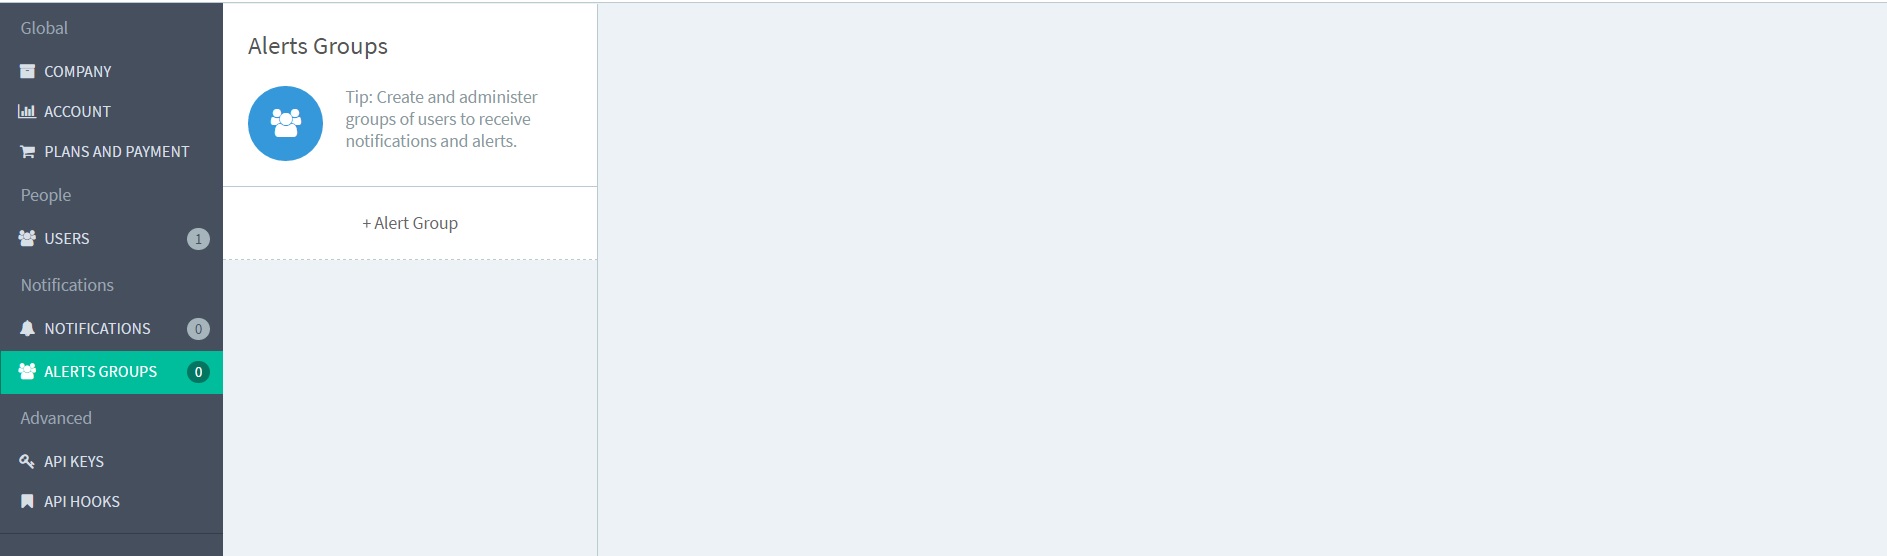
 The Alerts Groups section is the higher granularity notification system that includes integration with other software and platforms.
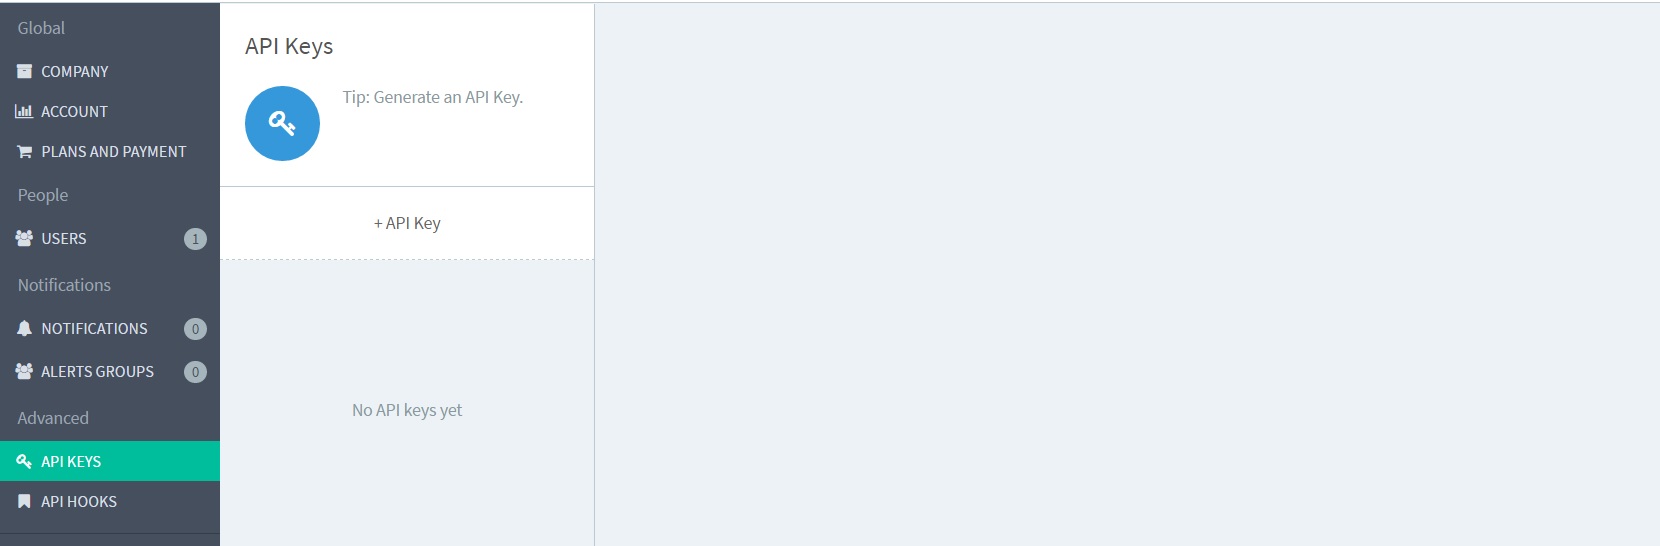
 The 
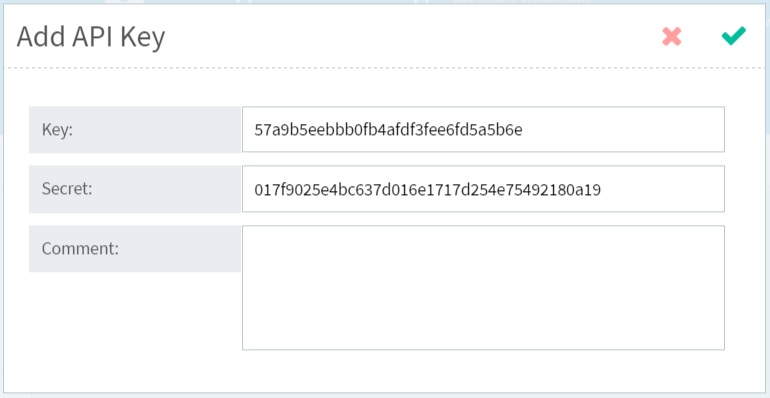
API Keys page is useful if you want to use the API. You just need to click the + API Key button to generate a key/secret pair. In the API Hooks section you can create the project hook for the v3 API. To get started, you will first need to create a hook for the project you want to interact with by clicking + API Hook button, choose the project the hook will refer to, choose a privileged user for this hook and copy the hook in your clipboard. The generated URL will give you the ability to query some resources of the connected project without needing any further authentication, so mind who you will share it with. If you feel the url has been improperly shared, you can revoke it from the page you used to create it. For all the update endpoints, a JWT token is required as part of the authorization process and the authenticating user has to match the user selected while creating the hook. For details about all the endpoints, please see the documentation here: http://docs.apifortressv3.apiary.io/ Lastly, two sections allow users to see status page. Big screens provides a URL to a real-time status page specifically designed for large screens that refreshes automatically made for internal users (it requires a valid username and password). The Shareable section allows you to create a URL for any purpose, such as being embedded in other pages. For more details about how to Generate a Status Page see here.    

Main dashboard

The main dashboard presents the list of your projects and an overview of their statuses. At the top of the page there is a chart showing the whole company status, it sums up the failures and successes of all the projects in your company for the last 24h. (More details about the failures and successes are available in the project dashboard). For every project you can see the number of tests, the number of the events happened in the last 2 days and the total failures (in the last 2 days). You can reach the dashboard, the tests list and the API Quality page with the dedicated buttons. On the right side of the screen, you can find the platform logs: choose to see only the relevant events (default) or all the events. Test failures and administrative operations are reported here.

Project dashboard

The Project Dashboard is the section of API Fortress where the project status and history are displayed. There are three main sections: Logs, Metrics and Availability. The data is collected from the scheduled runs and from the manual execution of a test outside the composer. The three sections have the same structure but with different content. Every section has a graph to show you the trend of the project of the last two days but you can see any day by selecting the specific date using the calendar feature. If you need to zoom into a particular time frame you can do it by selecting an area directly on the graph. You can filter results also by test name, by tags, by failures and by location.  On the top left part of the screen you can see some details about the tests: how many events have been created,  how many failures and successes, how many scheduled runs have been configured. The Logs section shows, as default view, the events in the last two days. Every event is listed in a table with test name, the date and time of the event, the location where the event happened, the status. You can limit the number of events displayed in the table by filtering the results by test name, by tag, by failures or by location. For every event, you can see the related report by clicking on a row and then on the related button. The reports are visible only to the registered users but you can generate a publicly shareable URL. The Metrics section shows you the performance of your endpoints. The default view displays the last two days. As in the Logs section, every event is listed in a table with a footprint, date and time when it happened, the latency and fetch, the location and status. The results can be filtered by footprint, location and failures. By clicking on any row you can see the details of the event or create an alert related to it. An alert allows you to be notified when fetch or latency of a specific footprint is greater than a value you set up.  Once set up, you can find it by clicking Monitors in the left panel; at any time you can edit or delete it. Lastly, the Availability section shows you the availability of your endpoints. The default view shows the last two days. The data is listed in a table that shows the endpoint, the date and time, the location and the status of any result. The results can be filtered by footprint, location and failures. If you need to view a specific log, metric or availability in a specific time range you can create your own query using the drop downs at the top of the page. The query allows you to filter by logs, by metrics or by availability by selecting the specific test name or the endpoint or the tag; choose a start and end  date for extending the time range (max 10 days allowed) and view only the failures. Every query performed is listed on the bottom of the left panel so you can easily retrieve it. If you want to keep it for later uses, you can save it by clicking on the heart icon. If the query makes sense also for other projects, it will be preserved and listed when you switch from one dashboard to another via the dedicated drop-down menu at the top of the left panel.      

Assert Compares

Allows you to compare two payloads in terms of text, structure or values. Parameters:
Name Type/Value Required
Expression 1 Expression Yes
Expression 2 Expression Yes
Mode Text, values, structure Yes
Level error, warning No
Stop test if fails True, false No
Expression 1: the first payload you want to compare. Expression 2: the second payload you want to compare. Mode: the comparator you wish to use. Text compares the text of the two payloads as plain text, values compares the two payloads regardless the text layout, structure compares only the structure of the two payloads. Level: Specifies, when the assertion fails, whether it should be considered an ‘error’ or just a ‘warning.’ A warning will not trigger alerts (such as email or text messages). Stop test if fails: The test will be immediately stopped if the assertion fails.

While

Allows you to run a block of assertions as long as a condition is valid. Parameters:
Name Type/Value Required
Expression Expression Yes
Expression: The condition that has to be met for the assertions block to be executed  

Expression language extensions

Preamble

The API Fortress expression language is mostly used to identify a path in a payload, or reference a variable. But there’s more to it. A number of extensions are available to generate calculated data, determine the quality of a value and so on. These extensions can be used in any field that can be evaluated, which means in all expression fields, and all the fields where the value is wrapped in the ${…} brackets.

anyArrray.pick(n)

Given any array, you can ask the system to create a random subset of it. One typical usage is when an iterator would turn out to be huge, and you prefer to cherry-pick a few items.
payload.artists.pick(5)
The code above will return an array of 5 random elements off the artists array. A hands on example:
<each expression="payload.artists.pick(5)">
    <assert-exists expression="_1.href" />
    <assert-exists expression="_1.id" />
    ...
</each>

anyArrray.pick()

Similar to the pick(n), this method will pick one random item off an array, and return it.

WSUtil

This is the main extension. It supports many useful functions.
  • composeUrl(base : String, params : Map) : String : creates a valid URL string based on these 2 params.
    WSUtil.composeUrl('http://www.testurlwhatever.com/index',['page':1] )
    
    Returns http://www.testurlwhatever.com/index?page=1
    WSUtil.composeUrl('http://www.testurlwhatever.com/index?offset=5',['page':1] )
    
    Returns http://www.testurlwhatever.com/index?offset=5&page=1
  • exists(object : Object) : Boolean : an XML and JSON existence state is different by definition. Use this in an “if statement” if a test should work both with JSON and XML
  • contains(substring : String, object : Object) : Boolean : returns true whether the string version of “object” contains the “substring” sub-string.
    WSUtil.contains('banana', payload.fruit.name)
    
  • isInteger(string: String) , isFloat(string: String), isUrl(string: String), isEmail(string: String), isPhoneNumber(string: String), isBoolean(string: String), isArray(object: Object), isMap(object: Object), isCreditCard(string: String) : Boolean : evaluate the nature of a data item

N

Utility functions for  numbers.
  • random(min: Int, max: Int) : Int : generates a random integer number between min and max.
    N.random(10,30)
    
  • random(min: Int, max: Int, quantity: Int) : List : generates a list of random numbers
    N.random(10,30,5)
    

D

Plays with dates.
  • nowMillis() : Int : returns the current Unix epoch in milliseconds.
  • plusDays(millis: Int, days: Int): Int : returns the provided milliseconds, plus the provided number of days
  • plusHours(millis: Int, hours: Int): Int : returns the provided milliseconds, plus the provided number of hours
  • minusDays(millis: Int, days: Int) : Int : returns the provided milliseconds, minus the provided number of days
  • minusHours(millis: Int, hours: Int): Int : returns the provided milliseconds, minus the provided number of hours
  • format(millis: Int, format: String) : String : creates a timestamp with the given format, using the current timezone
  • format(millis: Int, format: String, timezone: String) : String : creates a timestamp with the given format, based on the provided timezone id
  • format(millis: Int, format: String, offset: Int) : String : creates a timestamp with the given format, based on the provided timezone offset
  • parse(timestamp: String) : Int : tries to parse the provided timestamp and convert it in milliseconds. It will use current timezone if not provided
  • parse(timestamp: String, timezone: String) : Int : parses the provided timestamp and coverts it in milliseconds with the provided timezone id
  • parse(timestamp: String, offset: Int) : Int : parses the provided timestamp and coverts it in milliseconds with the provided timezone offset.
Here’s the conversion map for formats:
 Symbol  Meaning                      Presentation  Examples
 ------  -------                      ------------  -------
 G       era                          text          AD
 C       century of era (>=0)         number        20
 Y       year of era (>=0)            year          1996

 x       weekyear                     year          1996
 w       week of weekyear             number        27
 e       day of week                  number        2
 E       day of week                  text          Tuesday; Tue

 y       year                         year          1996
 D       day of year                  number        189
 M       month of year                month         July; Jul; 07
 d       day of month                 number        10

 a       halfday of day               text          PM
 K       hour of halfday (0~11)       number        0
 h       clockhour of halfday (1~12)  number        12

 H       hour of day (0~23)           number        0
 k       clockhour of day (1~24)      number        24
 m       minute of hour               number        30
 s       second of minute             number        55
 S       fraction of second           millis        978

 z       time zone                    text          Pacific Standard Time; PST
 Z       time zone offset/id          zone          -0800; -08:00; America/Los_Angeles

WSCrypto

Encryption utilities.
  • md5(input : String) : String : returns the md5 hash of the input string
  • hash(input : String) : String : returns the SHA-1 hash of the input string, hex encoded
  • genKey() : String : generates a a random key
  • base64(action: String, input: String) : decodes from or encodes into a base64 string. Action can either be ‘encode’ or ‘decode’
    WSCrypto.base64('encode','whatever')
    
  • base64Encode(input : Array[Byte]) : String : encodes a byte array in a base64 string.
  • sha256(input : String) : String : creates an hash of input using the SHA-256 algorithm
  • sha256(input : String, secret : String) : String : encrypts input with secret using the HMAC-SHA256 algorithm
  • hmacSha1(input : String, secret : String) : String : encrypts input with secret using the HMAC-SHA1 algorithm
  • toHex(input : Array[Byte]) : String : creates an hex version of a byte array

Test Control Panel

The Test Control Panel is where you perform some actions that have an effect on the whole test. Among these, controlling the working-copy / published lifecycle is the most relevant. See this article for further details. On the top area, you can see the details of the working copy and the live copy. In the screenshot below, the working copy is selected, so in the lower area, “Clear Working Copy” and “Publish” are available. By selecting the published versions, “Schedule” and “Copy to Clipboard” become available. The Compose button is always available and starts the test editing.
Other functions
  • Delete test: deletes the test permanently

Comment

This assertion allows you to print out (in test reports) information. It can have two sorts of values. The first is a normal string value. An example of that would be to explain what a specific WHEN loop is being used for. Similar to when you write comments in code. Example:
This is a comment
The second is useful for test debugging and analysis. You can pass variables into the comments. An example use of this would be to print out the product ID being used in the current loop of a test. Example:
The value of the ID is ${payload.id}